Estimated Value: $262,000 - $557,082
4
Beds
1
Bath
1,746
Sq Ft
$214/Sq Ft
Est. Value
About This Home
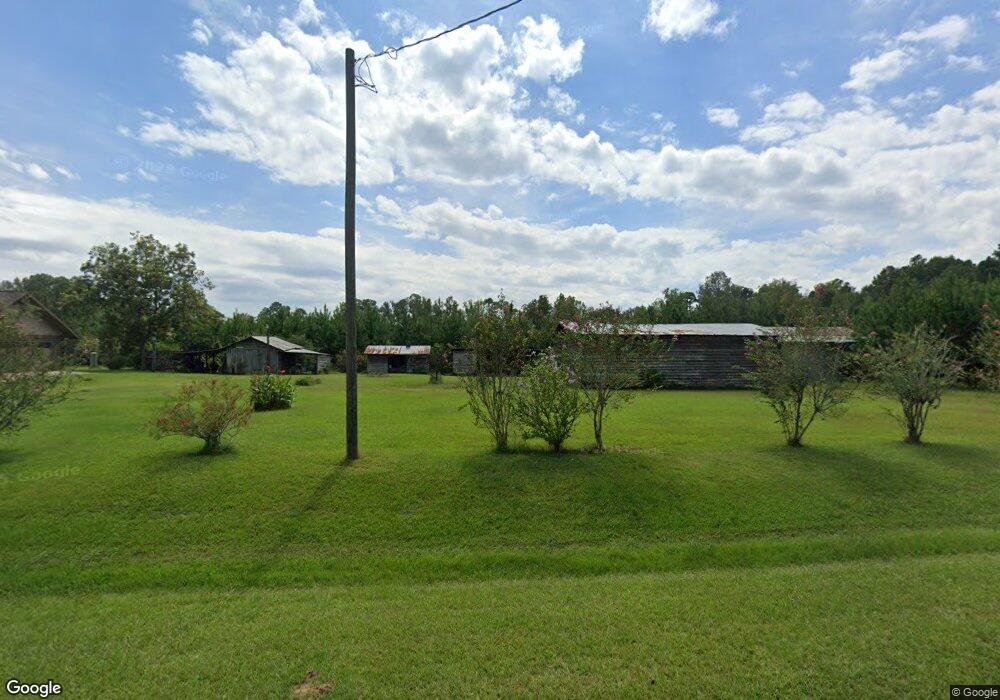
This home is located at 521 Dent Rd, Odum, GA 31555 and is currently estimated at $373,771, approximately $214 per square foot. 521 Dent Rd is a home located in Wayne County with nearby schools including Odum Elementary School, Martha Puckett Middle School, and Wayne County High School.
Ownership History
Date
Name
Owned For
Owner Type
Purchase Details
Closed on
Jun 26, 2025
Sold by
Hinesville Home Center Inc
Bought by
Pitts Jason Howard and Pitts Lalah
Current Estimated Value
Home Financials for this Owner
Home Financials are based on the most recent Mortgage that was taken out on this home.
Original Mortgage
$315,761
Outstanding Balance
$315,497
Interest Rate
6.89%
Mortgage Type
FHA
Estimated Equity
$58,275
Purchase Details
Closed on
Aug 11, 2017
Sold by
Dukes Joann C
Bought by
Pye Brian
Purchase Details
Closed on
Jul 29, 2011
Sold by
Dukes Joann C and Estate Of Emory C Dukes
Bought by
Dukes Joann C
Create a Home Valuation Report for This Property
The Home Valuation Report is an in-depth analysis detailing your home's value as well as a comparison with similar homes in the area
Home Values in the Area
Average Home Value in this Area
Purchase History
| Date | Buyer | Sale Price | Title Company |
|---|---|---|---|
| Pitts Jason Howard | $335,500 | -- | |
| Hinesville Home Center Inc | -- | -- | |
| Pye Brian | -- | -- | |
| Dukes Joann C | -- | -- |
Source: Public Records
Mortgage History
| Date | Status | Borrower | Loan Amount |
|---|---|---|---|
| Open | Hinesville Home Center Inc | $315,761 |
Source: Public Records
Tax History Compared to Growth
Tax History
| Year | Tax Paid | Tax Assessment Tax Assessment Total Assessment is a certain percentage of the fair market value that is determined by local assessors to be the total taxable value of land and additions on the property. | Land | Improvement |
|---|---|---|---|---|
| 2024 | $1,205 | $157,766 | $76,193 | $81,573 |
| 2023 | $941 | $147,725 | $76,193 | $71,532 |
| 2022 | $1,097 | $133,666 | $76,193 | $57,473 |
| 2021 | $1,058 | $125,732 | $76,193 | $49,539 |
| 2020 | $1,135 | $120,886 | $71,347 | $49,539 |
| 2019 | $1,194 | $120,886 | $71,347 | $49,539 |
| 2018 | $1,186 | $120,886 | $71,347 | $49,539 |
| 2017 | $743 | $114,811 | $65,272 | $49,539 |
| 2016 | $681 | $114,811 | $65,272 | $49,539 |
| 2014 | $672 | $114,811 | $65,272 | $49,539 |
| 2013 | -- | $49,538 | $0 | $49,538 |
Source: Public Records
Map
Nearby Homes
- 2936 Madray Springs Rd
- 17380 Lanes Bridge Rd
- 17614 Lanes Bridge Rd
- 6555 Lanes Bridge Rd
- 0 Oglethorpe Rd
- 11235 Lanes Bridge Rd
- 19 Cardinal Ln
- 0 Gene Bland Rd
- 1 Gene Bland Rd
- 803 Gene Bland Rd
- 167 Sharpe Pond Ln
- 858 Hoke Ogden Rd
- 222 Edenfield Rd
- 269 Colleen Ln
- 88 Northshore Ave
- Morris Break Rd
- Morris Break Rd
- Morris Break Rd
- 10 Beards Bluff Rd
- 0 Beards Bluff Rd