Estimated Value: $352,596 - $371,000
4
Beds
1
Bath
2,244
Sq Ft
$161/Sq Ft
Est. Value
About This Home
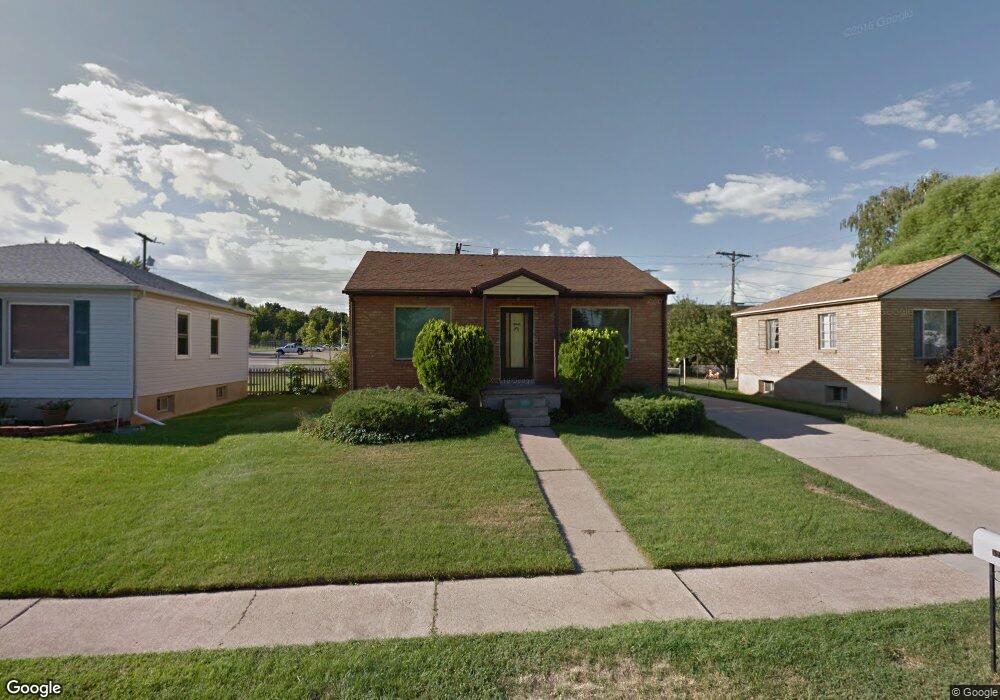
This home is located at 521 Diana St, Ogden, UT 84403 and is currently estimated at $362,399, approximately $161 per square foot. 521 Diana St is a home located in Weber County with nearby schools including Burch Creek School, South Ogden Junior High School, and Bonneville High School.
Ownership History
Date
Name
Owned For
Owner Type
Purchase Details
Closed on
May 4, 2022
Sold by
Young Rennie and Elias Raymond
Bought by
Young Rennie
Current Estimated Value
Home Financials for this Owner
Home Financials are based on the most recent Mortgage that was taken out on this home.
Original Mortgage
$219,900
Outstanding Balance
$207,263
Interest Rate
4.42%
Mortgage Type
New Conventional
Estimated Equity
$155,136
Purchase Details
Closed on
Dec 10, 2018
Sold by
Hampton Laurie G
Bought by
Young Rennie and Elias Raymond
Home Financials for this Owner
Home Financials are based on the most recent Mortgage that was taken out on this home.
Original Mortgage
$190,704
Interest Rate
5.75%
Mortgage Type
FHA
Purchase Details
Closed on
Nov 21, 2018
Sold by
Hampton Dale J
Bought by
Hampton Laurie G
Home Financials for this Owner
Home Financials are based on the most recent Mortgage that was taken out on this home.
Original Mortgage
$190,704
Interest Rate
5.75%
Mortgage Type
FHA
Create a Home Valuation Report for This Property
The Home Valuation Report is an in-depth analysis detailing your home's value as well as a comparison with similar homes in the area
Home Values in the Area
Average Home Value in this Area
Purchase History
| Date | Buyer | Sale Price | Title Company |
|---|---|---|---|
| Young Rennie | -- | Mortgage Connect | |
| Young Rennie | -- | First Amer Fashion Pointe | |
| Hampton Laurie G | -- | First Amer Fashion Pointe |
Source: Public Records
Mortgage History
| Date | Status | Borrower | Loan Amount |
|---|---|---|---|
| Open | Young Rennie | $219,900 | |
| Previous Owner | Young Rennie | $190,704 |
Source: Public Records
Tax History Compared to Growth
Tax History
| Year | Tax Paid | Tax Assessment Tax Assessment Total Assessment is a certain percentage of the fair market value that is determined by local assessors to be the total taxable value of land and additions on the property. | Land | Improvement |
|---|---|---|---|---|
| 2025 | $2,547 | $351,209 | $98,393 | $252,816 |
| 2024 | $2,371 | $183,699 | $54,116 | $129,583 |
| 2023 | $2,234 | $173,250 | $55,497 | $117,753 |
| 2022 | $2,303 | $185,900 | $44,626 | $141,274 |
| 2021 | $1,879 | $251,000 | $46,822 | $204,178 |
| 2020 | $1,654 | $203,000 | $37,270 | $165,730 |
| 2019 | $1,536 | $178,000 | $29,400 | $148,600 |
| 2018 | $1,421 | $155,000 | $29,400 | $125,600 |
| 2017 | $1,315 | $136,000 | $27,491 | $108,509 |
| 2016 | $1,195 | $68,016 | $15,619 | $52,397 |
| 2015 | $1,179 | $65,631 | $15,619 | $50,012 |
| 2014 | $1,072 | $58,017 | $15,619 | $42,398 |
Source: Public Records
Map
Nearby Homes