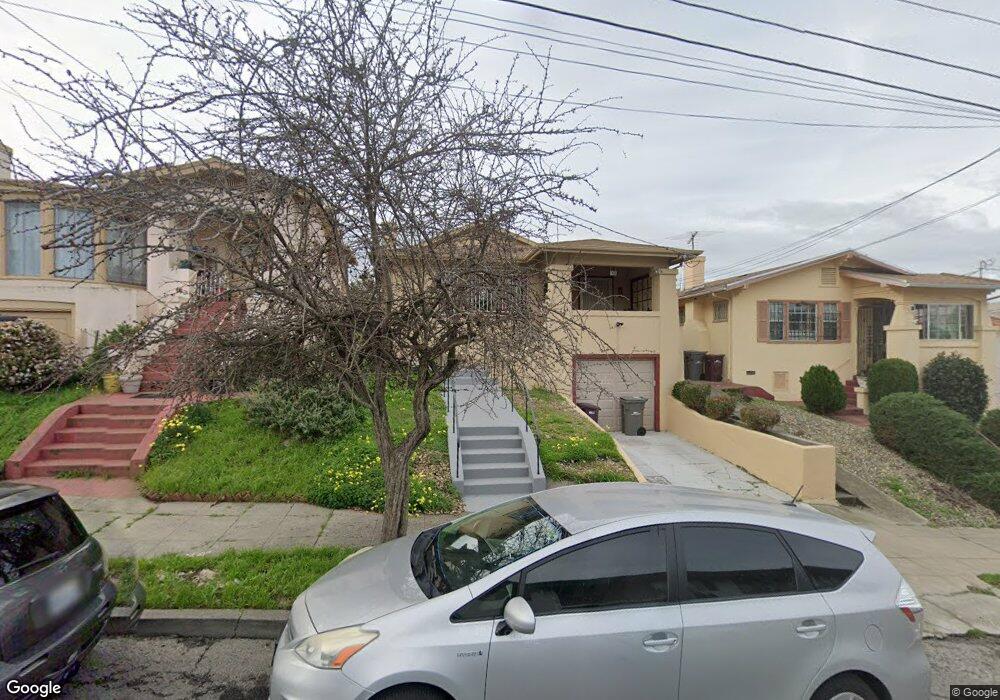
521 E 20th St Oakland, CA 94606
Ivy Hill NeighborhoodEstimated Value: $1,060,000 - $1,395,153
10
Beds
5
Baths
3,700
Sq Ft
$330/Sq Ft
Est. Value
About This Home
This home is located at 521 E 20th St, Oakland, CA 94606 and is currently estimated at $1,221,788, approximately $330 per square foot. 521 E 20th St is a home located in Alameda County with nearby schools including Bella Vista Elementary School, Edna Brewer Middle School, and Oakland High School.
Ownership History
Date
Name
Owned For
Owner Type
Purchase Details
Closed on
Jan 29, 2024
Sold by
Kwan Andrew and Kwan Jasper
Bought by
Kwan Andrew and Kwan Jasper
Current Estimated Value
Home Financials for this Owner
Home Financials are based on the most recent Mortgage that was taken out on this home.
Original Mortgage
$500,000
Outstanding Balance
$488,702
Interest Rate
6.62%
Mortgage Type
New Conventional
Estimated Equity
$733,086
Purchase Details
Closed on
Jan 9, 2016
Sold by
Kwan Git Hing and Kwan Leon
Bought by
Kwan Andrew and Kwan Jasper
Purchase Details
Closed on
Jun 16, 2005
Sold by
Kwan Git Hing and Kwan Leon
Bought by
Kwan Git Hing and Kwan Leon
Home Financials for this Owner
Home Financials are based on the most recent Mortgage that was taken out on this home.
Original Mortgage
$422,000
Interest Rate
5.72%
Mortgage Type
New Conventional
Purchase Details
Closed on
Mar 26, 2004
Sold by
Kwan Git Hing
Bought by
Kwan Git Hing and Kwan Leon
Home Financials for this Owner
Home Financials are based on the most recent Mortgage that was taken out on this home.
Original Mortgage
$426,000
Interest Rate
3.88%
Mortgage Type
Purchase Money Mortgage
Purchase Details
Closed on
Sep 18, 2003
Sold by
Tang Chiu Fong
Bought by
Kwan Git Hing
Home Financials for this Owner
Home Financials are based on the most recent Mortgage that was taken out on this home.
Original Mortgage
$368,000
Interest Rate
5.5%
Mortgage Type
Purchase Money Mortgage
Purchase Details
Closed on
Feb 15, 2000
Sold by
Lam Jun Y
Bought by
Brittan William John and Oneil Elizabeth A
Home Financials for this Owner
Home Financials are based on the most recent Mortgage that was taken out on this home.
Original Mortgage
$248,000
Interest Rate
7.87%
Purchase Details
Closed on
Nov 30, 1999
Sold by
Lam Leung Y and Lam Jun Y
Bought by
Lam Jun You
Purchase Details
Closed on
Feb 3, 1994
Sold by
Lam Jun You
Bought by
Lam Leung Yin and Lam Jun You
Create a Home Valuation Report for This Property
The Home Valuation Report is an in-depth analysis detailing your home's value as well as a comparison with similar homes in the area
Home Values in the Area
Average Home Value in this Area
Purchase History
| Date | Buyer | Sale Price | Title Company |
|---|---|---|---|
| Kwan Andrew | -- | Chicago Title | |
| Kwan Andrew | -- | Chicago Title | |
| Kwan Andrew | -- | None Available | |
| Kwan Git Hing | -- | Ticor Title Company Of Ca | |
| Kwan Git Hing | $213,000 | Alliance Title Company | |
| Kwan Git Hing | -- | Fidelity National Title Co | |
| Kwan Git Hing | $568,000 | Fidelity National Title Co | |
| Brittan William John | $310,000 | Commonwealth Land Title Co | |
| Lam Jun You | -- | -- | |
| Lam Leung Yin | -- | -- |
Source: Public Records
Mortgage History
| Date | Status | Borrower | Loan Amount |
|---|---|---|---|
| Open | Kwan Andrew | $500,000 | |
| Closed | Kwan Andrew | $500,000 | |
| Previous Owner | Kwan Git Hing | $422,000 | |
| Previous Owner | Kwan Git Hing | $426,000 | |
| Previous Owner | Kwan Git Hing | $368,000 | |
| Previous Owner | Brittan William John | $248,000 |
Source: Public Records
Tax History
| Year | Tax Paid | Tax Assessment Tax Assessment Total Assessment is a certain percentage of the fair market value that is determined by local assessors to be the total taxable value of land and additions on the property. | Land | Improvement |
|---|---|---|---|---|
| 2025 | $13,524 | $938,340 | $283,602 | $661,738 |
| 2024 | $13,524 | $919,806 | $278,042 | $648,764 |
| 2023 | $14,246 | $901,636 | $272,591 | $636,045 |
| 2022 | $13,909 | $883,821 | $267,246 | $623,575 |
| 2021 | $13,388 | $866,357 | $262,007 | $611,350 |
| 2020 | $13,241 | $864,407 | $259,322 | $605,085 |
| 2019 | $12,800 | $847,458 | $254,237 | $593,221 |
| 2018 | $12,529 | $830,846 | $249,254 | $581,592 |
| 2017 | $12,071 | $814,554 | $244,366 | $570,188 |
| 2016 | $10,153 | $682,167 | $204,650 | $477,517 |
| 2015 | $10,099 | $671,920 | $201,576 | $470,344 |
| 2014 | $8,724 | $555,000 | $166,500 | $388,500 |
Source: Public Records
Map
Nearby Homes
- 501 E 20th St
- 725 E 21st St
- 812 E 19th St
- 836 E 19th St
- 2306 Ivy Dr
- 322 Hanover Ave Unit 409
- 322 Hanover Ave Unit 107
- 1549 5th Ave
- 402 Newton Ave
- 415 Foothill Blvd
- 726 E 23rd St
- 335 Hanover Ave
- 1532 5th Ave
- 842 E 17th St
- 400 Wayne Ave Unit 1
- 1431 5th Ave Unit 2
- 807 Brooklyn Ave
- 635 E 15th St
- 1439 7th Ave
- 650 Hillsborough St
Your Personal Tour Guide
Ask me questions while you tour the home.