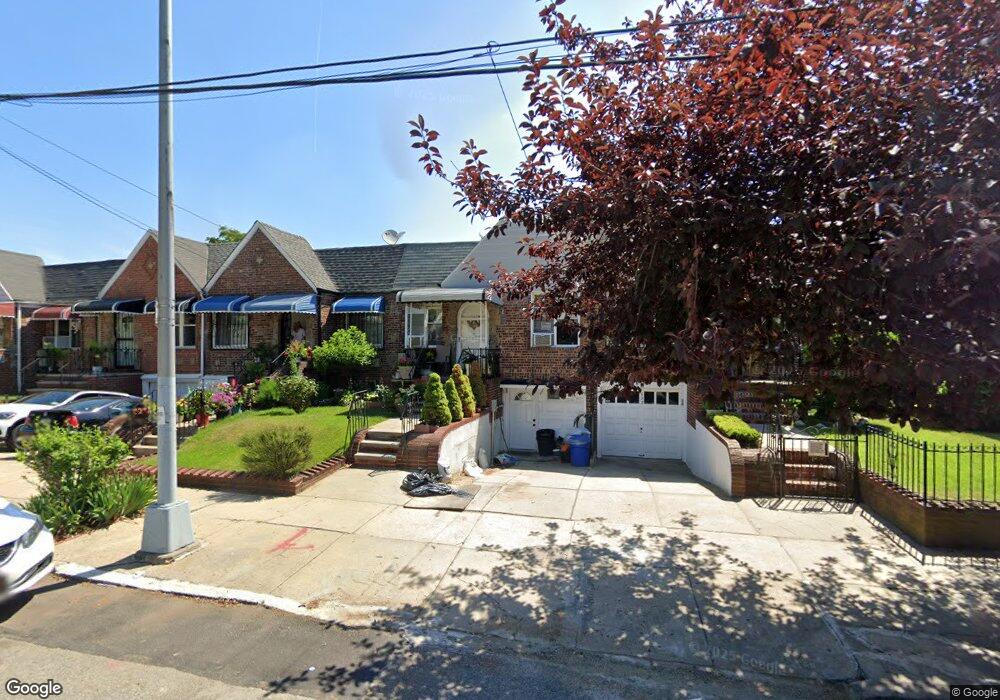
521 E 42nd St Brooklyn, NY 11203
East Flatbush NeighborhoodEstimated Value: $657,000 - $673,986
Studio
--
Bath
909
Sq Ft
$731/Sq Ft
Est. Value
About This Home
This home is located at 521 E 42nd St, Brooklyn, NY 11203 and is currently estimated at $664,497, approximately $731 per square foot. 521 E 42nd St is a home located in Kings County with nearby schools including P.S. 208 Elsa Ebeling, I.S. 285 Meyer Levin, and Great Oaks Elementary School.
Ownership History
Date
Name
Owned For
Owner Type
Purchase Details
Closed on
Dec 18, 2015
Sold by
Mcnair Nicole
Bought by
Campbell Yvette
Current Estimated Value
Purchase Details
Closed on
Oct 17, 2007
Sold by
Campbell Yvette
Bought by
Mcnair Nicole
Purchase Details
Closed on
Dec 14, 2006
Sold by
Oilver Hope and Oliver Delroy
Bought by
Campbell Yvette
Home Financials for this Owner
Home Financials are based on the most recent Mortgage that was taken out on this home.
Original Mortgage
$79,500
Interest Rate
6.29%
Create a Home Valuation Report for This Property
The Home Valuation Report is an in-depth analysis detailing your home's value as well as a comparison with similar homes in the area
Home Values in the Area
Average Home Value in this Area
Purchase History
| Date | Buyer | Sale Price | Title Company |
|---|---|---|---|
| Campbell Yvette | -- | -- | |
| Campbell Yvette | -- | -- | |
| Mcnair Nicole | -- | -- | |
| Mcnair Nicole | -- | -- | |
| Campbell Yvette | $397,500 | -- | |
| Campbell Yvette | $397,500 | -- |
Source: Public Records
Mortgage History
| Date | Status | Borrower | Loan Amount |
|---|---|---|---|
| Previous Owner | Campbell Yvette | $79,500 | |
| Previous Owner | Campbell Yvette | $318,000 |
Source: Public Records
Tax History
| Year | Tax Paid | Tax Assessment Tax Assessment Total Assessment is a certain percentage of the fair market value that is determined by local assessors to be the total taxable value of land and additions on the property. | Land | Improvement |
|---|---|---|---|---|
| 2025 | $5,573 | $32,040 | $12,480 | $19,560 |
| 2024 | $5,573 | $32,400 | $12,480 | $19,920 |
| 2023 | $5,317 | $39,000 | $12,480 | $26,520 |
| 2022 | $5,226 | $31,680 | $12,480 | $19,200 |
| 2021 | $5,200 | $33,480 | $12,480 | $21,000 |
| 2020 | $2,564 | $30,840 | $12,480 | $18,360 |
| 2019 | $4,837 | $33,180 | $12,480 | $20,700 |
| 2018 | $4,447 | $21,816 | $10,266 | $11,550 |
| 2017 | $4,447 | $21,816 | $11,344 | $10,472 |
| 2016 | $4,117 | $20,592 | $11,735 | $8,857 |
| 2015 | $2,483 | $20,426 | $12,752 | $7,674 |
| 2014 | $2,483 | $19,270 | $13,571 | $5,699 |
Source: Public Records
Map
Nearby Homes
- 1246 Troy Ave
- 1245 Troy Ave
- 4122 Avenue D
- 4404 Clarendon Rd
- 4309 Clarendon Rd
- 515 E 40th St
- 442 E 43rd St
- 530 E 40th St
- 469 E 40th St
- 1359 Albany Ave
- 3906 Avenue D
- 627 E 42nd St
- 1214 Schenectady Ave
- 655 E 39th St
- 4623 Avenue D
- 527 E 38th St
- 4617 Clarendon Rd
- 1278 Schenectady Ave
- 1352 Troy Ave
- 868 E 46th St
Your Personal Tour Guide
Ask me questions while you tour the home.