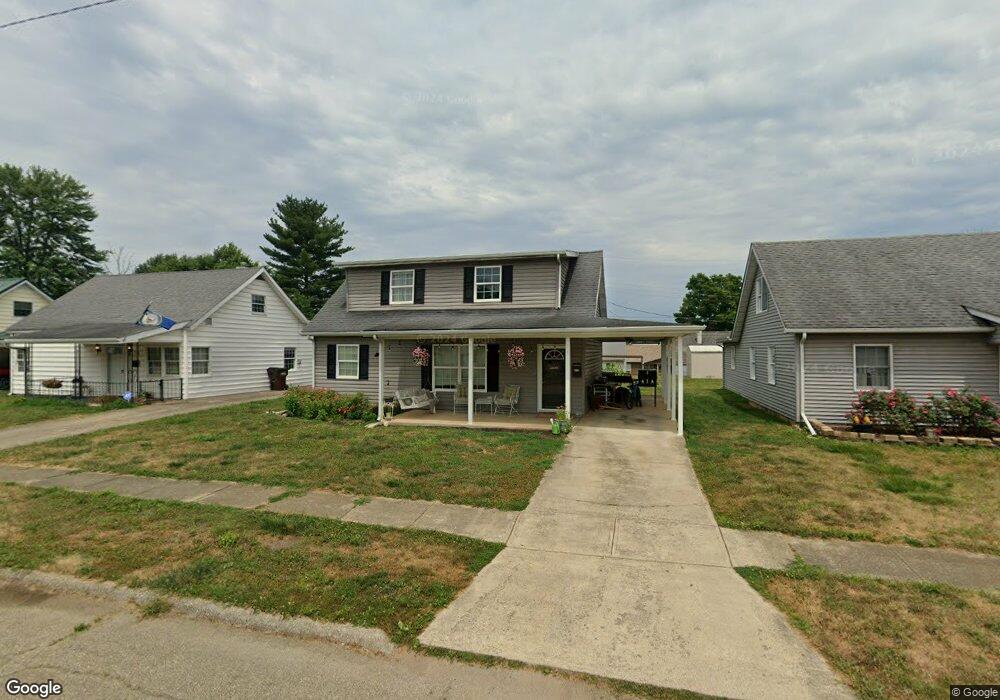
521 E 4th St Waverly, OH 45690
Estimated Value: $138,000 - $155,735
3
Beds
1
Bath
800
Sq Ft
$184/Sq Ft
Est. Value
About This Home
This home is located at 521 E 4th St, Waverly, OH 45690 and is currently estimated at $147,184, approximately $183 per square foot. 521 E 4th St is a home located in Pike County with nearby schools including Waverly Primary School, Waverly Intermediate School, and Waverly Junior High School.
Ownership History
Date
Name
Owned For
Owner Type
Purchase Details
Closed on
Dec 31, 2024
Sold by
Howard Companies Inc
Bought by
Brownfield Sean and Brownfield Kelly
Current Estimated Value
Purchase Details
Closed on
Sep 5, 2024
Sold by
Ohio Valley Property Management Llc
Bought by
Howard Companies Inc
Purchase Details
Closed on
Dec 3, 2013
Sold by
Howard Companies Inc
Bought by
Ohio Valley Property Management Llc
Purchase Details
Closed on
Jun 26, 2009
Sold by
Hwang Thoms C and Hwang Thomas W
Bought by
Howard Companies Inc
Create a Home Valuation Report for This Property
The Home Valuation Report is an in-depth analysis detailing your home's value as well as a comparison with similar homes in the area
Home Values in the Area
Average Home Value in this Area
Purchase History
| Date | Buyer | Sale Price | Title Company |
|---|---|---|---|
| Brownfield Sean | $141,500 | None Listed On Document | |
| Howard Companies Inc | -- | None Listed On Document | |
| Ohio Valley Property Management Llc | -- | None Available | |
| Howard Companies Inc | $45,000 | None Available |
Source: Public Records
Tax History
| Year | Tax Paid | Tax Assessment Tax Assessment Total Assessment is a certain percentage of the fair market value that is determined by local assessors to be the total taxable value of land and additions on the property. | Land | Improvement |
|---|---|---|---|---|
| 2025 | $1,589 | $42,110 | $6,930 | $35,180 |
| 2024 | $1,589 | $42,110 | $6,930 | $35,180 |
| 2023 | $1,530 | $42,110 | $6,930 | $35,180 |
| 2022 | $1,123 | $26,880 | $5,350 | $21,530 |
| 2021 | $1,103 | $26,880 | $5,350 | $21,530 |
| 2020 | $1,103 | $26,880 | $5,350 | $21,530 |
| 2019 | $911 | $21,980 | $4,540 | $17,440 |
| 2018 | $701 | $21,980 | $4,540 | $17,440 |
| 2017 | $968 | $23,720 | $4,540 | $19,180 |
| 2016 | $493 | $11,630 | $3,870 | $7,760 |
| 2015 | $493 | $11,630 | $3,870 | $7,760 |
| 2014 | $478 | $11,630 | $3,870 | $7,760 |
| 2013 | $484 | $11,630 | $3,870 | $7,760 |
| 2012 | -- | $11,630 | $3,870 | $7,760 |
Source: Public Records
Map
Nearby Homes
Your Personal Tour Guide
Ask me questions while you tour the home.