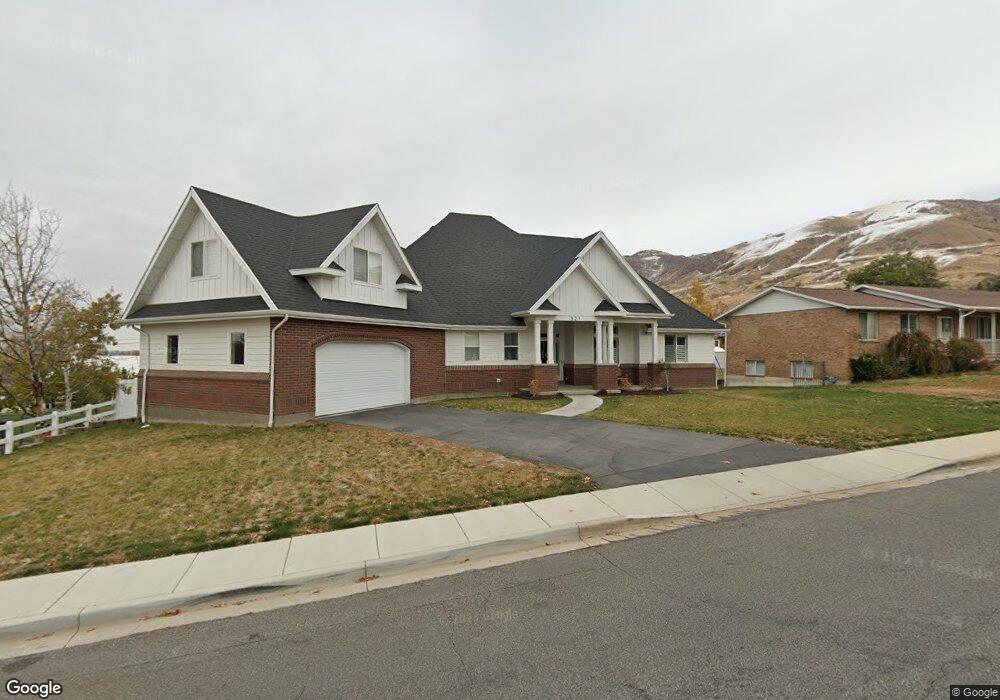
521 E 900 N Bountiful, UT 84010
Estimated Value: $653,000 - $849,000
3
Beds
3
Baths
2,765
Sq Ft
$276/Sq Ft
Est. Value
About This Home
This home is located at 521 E 900 N, Bountiful, UT 84010 and is currently estimated at $763,967, approximately $276 per square foot. 521 E 900 N is a home located in Davis County with nearby schools including Tolman School, Bountiful Junior High School, and Viewmont High School.
Ownership History
Date
Name
Owned For
Owner Type
Purchase Details
Closed on
Aug 24, 2020
Sold by
Bowen Bert and Bowen Stephanie
Bought by
Bowen Bert and Bowen Stephanie
Current Estimated Value
Home Financials for this Owner
Home Financials are based on the most recent Mortgage that was taken out on this home.
Original Mortgage
$510,400
Interest Rate
2.9%
Mortgage Type
New Conventional
Purchase Details
Closed on
Mar 31, 2008
Sold by
Stratton Mark E and Stratton Debbie
Bought by
Stratton Mark E and Stratton Debora B
Home Financials for this Owner
Home Financials are based on the most recent Mortgage that was taken out on this home.
Original Mortgage
$139,000
Interest Rate
5.72%
Mortgage Type
New Conventional
Purchase Details
Closed on
Nov 10, 1998
Sold by
Stratton Emmett G and Stratton Shirlene R
Bought by
Stratton Mark E and Stratton Debora B
Create a Home Valuation Report for This Property
The Home Valuation Report is an in-depth analysis detailing your home's value as well as a comparison with similar homes in the area
Purchase History
| Date | Buyer | Sale Price | Title Company |
|---|---|---|---|
| Bowen Bert | -- | Wasatch Title Insu | |
| Stratton Mark E | -- | First American Title | |
| Stratton Mark E | -- | -- |
Source: Public Records
Mortgage History
| Date | Status | Borrower | Loan Amount |
|---|---|---|---|
| Closed | Bowen Bert | $510,400 | |
| Closed | Stratton Mark E | $139,000 |
Source: Public Records
Tax History
| Year | Tax Paid | Tax Assessment Tax Assessment Total Assessment is a certain percentage of the fair market value that is determined by local assessors to be the total taxable value of land and additions on the property. | Land | Improvement |
|---|---|---|---|---|
| 2025 | $4,841 | $447,150 | $153,721 | $293,429 |
| 2024 | $4,507 | $428,450 | $141,403 | $287,047 |
| 2023 | $4,365 | $753,000 | $260,705 | $492,295 |
| 2022 | $4,701 | $446,050 | $139,430 | $306,620 |
| 2021 | $4,343 | $632,000 | $207,606 | $424,394 |
| 2020 | $3,923 | $561,000 | $188,940 | $372,060 |
| 2019 | $3,938 | $550,000 | $176,632 | $373,368 |
| 2018 | $2,334 | $317,389 | $165,341 | $152,048 |
Source: Public Records
Map
Nearby Homes
- 662 E 1200 N
- 453 N 400 E Unit 7-D
- 345 N 400 E
- 975 E 1050 N
- 610 E Pages Ln
- 1023 E 800 N
- 1420 N Main St
- 683 E 100 N
- 1105 E 600 N
- 967 S Courtyard Ln
- 908 Northern Hills Dr Unit 3
- 49 E 200 N Unit 4
- 41 E 200 N Unit 6
- 933 Northern Hills Cir
- 55 E 200 N Unit 2
- 106 W 700 N
- 51 E 200 N Unit 3
- 256 N Main St
- 252 N Main St
- 254 N Main St
Your Personal Tour Guide
Ask me questions while you tour the home.