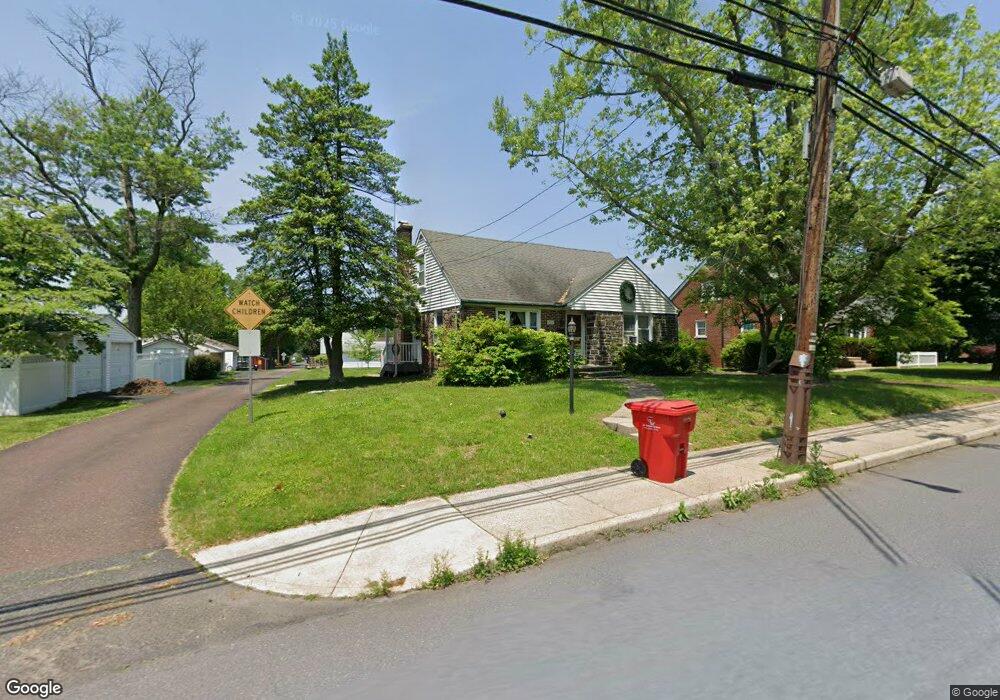
521 E Cherry Ln Souderton, PA 18964
Estimated Value: $438,727 - $466,000
3
Beds
2
Baths
1,694
Sq Ft
$268/Sq Ft
Est. Value
About This Home
This home is located at 521 E Cherry Ln, Souderton, PA 18964 and is currently estimated at $454,432, approximately $268 per square foot. 521 E Cherry Ln is a home located in Montgomery County with nearby schools including E M Crouthamel Elementary School, Indian Crest Middle School, and Souderton Area Senior High School.
Ownership History
Date
Name
Owned For
Owner Type
Purchase Details
Closed on
Oct 15, 2003
Sold by
Freeman Richard T
Bought by
Freeman Richard T and Freeman Terry
Current Estimated Value
Home Financials for this Owner
Home Financials are based on the most recent Mortgage that was taken out on this home.
Original Mortgage
$25,000
Outstanding Balance
$11,538
Interest Rate
6.05%
Estimated Equity
$442,894
Purchase Details
Closed on
Apr 18, 2003
Sold by
Snyder Deborah A and Snyder Wayne B
Bought by
Freeman Richard T
Purchase Details
Closed on
Aug 11, 2000
Sold by
Beers Robert G and Beers Marlene H
Bought by
Snyder Wayne B and Snyder Deborah A
Purchase Details
Closed on
May 16, 1996
Sold by
Musselman Grant
Bought by
Beers Robert G and Beers Marlene H
Create a Home Valuation Report for This Property
The Home Valuation Report is an in-depth analysis detailing your home's value as well as a comparison with similar homes in the area
Home Values in the Area
Average Home Value in this Area
Purchase History
| Date | Buyer | Sale Price | Title Company |
|---|---|---|---|
| Freeman Richard T | -- | Assured Quality Title Co | |
| Freeman Richard T | $200,850 | -- | |
| Snyder Wayne B | $150,000 | -- | |
| Beers Robert G | $139,500 | -- |
Source: Public Records
Mortgage History
| Date | Status | Borrower | Loan Amount |
|---|---|---|---|
| Open | Freeman Richard T | $25,000 |
Source: Public Records
Tax History
| Year | Tax Paid | Tax Assessment Tax Assessment Total Assessment is a certain percentage of the fair market value that is determined by local assessors to be the total taxable value of land and additions on the property. | Land | Improvement |
|---|---|---|---|---|
| 2025 | $5,683 | $125,850 | $48,930 | $76,920 |
| 2024 | $5,683 | $125,850 | $48,930 | $76,920 |
| 2023 | $5,344 | $125,850 | $48,930 | $76,920 |
| 2022 | $5,197 | $125,850 | $48,930 | $76,920 |
| 2021 | $5,071 | $125,850 | $48,930 | $76,920 |
| 2020 | $4,994 | $125,850 | $48,930 | $76,920 |
| 2019 | $4,940 | $125,850 | $48,930 | $76,920 |
Source: Public Records
Map
Nearby Homes
- 532 Lincoln Ave
- 120 Fox Hunt Dr
- 13 S 4th St Unit 19
- 20 N School Ln
- 12 Chatham Ct
- 208 E Broad St
- 13 Asheton Ln
- 216 W Cherry Ln Unit MAGNOLIA
- 216 W Cherry Ln Unit DEVONSHIRE
- 216 W Cherry Ln Unit ARCADIA
- 216 W Cherry Ln Unit COVINGTON
- 25 E Township Line Rd
- 1020 Spur Rd
- 140 N County Line Rd
- 54 W Chestnut St
- 52 Hillside Ave
- 241 Diamond St
- 318 Parkview Dr
- 330 Fairhill Rd
- 111 Reliance Cir Unit 111
- 525 E Cherry Ln
- 227 S 5th St
- 221 S 5th St
- 531 E Cherry Ln
- 235 S 5th St
- 215 S 5th St
- 518 E Garfield Ave
- 209 S 5th St
- 522 E Garfield Ave
- 545 E Cherry Ln
- 62 E Cherry Ln
- 526 E Garfield Ave
- 205 S 5th St
- 60 E Cherry Ln
- 220 S 5th St
- 80 E Cherry Ln
- 553 E Cherry Ln
- 214 S 5th St
- 530 E Garfield Ave
- 70 E Cherry Ln
Your Personal Tour Guide
Ask me questions while you tour the home.