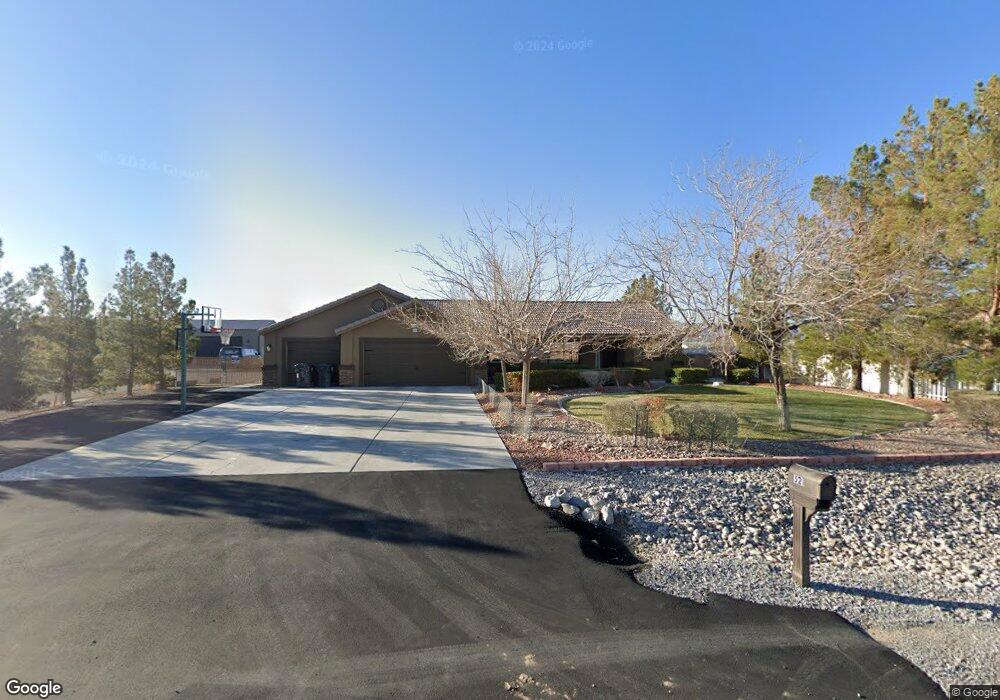
521 E Hickory St Unit 4A Pahrump, NV 89048
Estimated Value: $422,421 - $498,000
4
Beds
2
Baths
1,876
Sq Ft
$245/Sq Ft
Est. Value
About This Home
This home is located at 521 E Hickory St Unit 4A, Pahrump, NV 89048 and is currently estimated at $459,355, approximately $244 per square foot. 521 E Hickory St Unit 4A is a home located in Nye County with nearby schools including Floyd Elementary School, Rosemary Clarke Middle School, and Pahrump Valley High School.
Ownership History
Date
Name
Owned For
Owner Type
Purchase Details
Closed on
Aug 11, 2016
Sold by
Simunick Christopher and Simunick Christopher T
Bought by
The Thor Trust
Current Estimated Value
Purchase Details
Closed on
Aug 17, 2010
Sold by
Simunick Faith
Bought by
Simunick Christopher
Purchase Details
Closed on
Jun 29, 2009
Sold by
Npl Construction Co
Bought by
Simunick Christopher T and Simunick Faith M
Home Financials for this Owner
Home Financials are based on the most recent Mortgage that was taken out on this home.
Original Mortgage
$142,373
Interest Rate
4.79%
Mortgage Type
FHA
Purchase Details
Closed on
Dec 19, 2008
Sold by
Hill Lorren and Hill Jill
Bought by
Npl Construction Co
Purchase Details
Closed on
Jun 6, 2006
Sold by
Sambar Shawki S and Sambar Marilyn M
Bought by
Hill Lorren and Hill Jill
Home Financials for this Owner
Home Financials are based on the most recent Mortgage that was taken out on this home.
Original Mortgage
$256,000
Interest Rate
6.57%
Mortgage Type
Purchase Money Mortgage
Create a Home Valuation Report for This Property
The Home Valuation Report is an in-depth analysis detailing your home's value as well as a comparison with similar homes in the area
Purchase History
| Date | Buyer | Sale Price | Title Company |
|---|---|---|---|
| The Thor Trust | -- | None Available | |
| Simunick Christopher | -- | Napa Land Title | |
| Simunick Christopher T | $145,000 | Fidelity National Title | |
| Npl Construction Co | $315,000 | Chicago Title | |
| Hill Lorren | $320,000 | Lawyers Title Of Nevada Inc |
Source: Public Records
Mortgage History
| Date | Status | Borrower | Loan Amount |
|---|---|---|---|
| Previous Owner | Simunick Christopher T | $142,373 | |
| Previous Owner | Hill Lorren | $256,000 |
Source: Public Records
Tax History
| Year | Tax Paid | Tax Assessment Tax Assessment Total Assessment is a certain percentage of the fair market value that is determined by local assessors to be the total taxable value of land and additions on the property. | Land | Improvement |
|---|---|---|---|---|
| 2025 | $2,348 | $86,082 | $2,894 | $83,188 |
| 2024 | $2,348 | $85,948 | $2,894 | $83,054 |
| 2023 | $2,348 | $80,396 | $2,894 | $77,502 |
| 2022 | $2,015 | $72,486 | $2,894 | $69,592 |
| 2021 | $1,871 | $69,494 | $2,315 | $67,179 |
| 2020 | $1,797 | $69,264 | $2,315 | $66,949 |
| 2019 | $1,682 | $80,820 | $2,315 | $78,505 |
| 2018 | $1,607 | $77,757 | $1,852 | $75,905 |
| 2017 | $1,544 | $62,292 | $1,852 | $60,440 |
| 2016 | $1,505 | $36,875 | $1,852 | $35,023 |
| 2015 | $1,232 | $34,122 | $1,852 | $32,270 |
| 2014 | $1,195 | $36,891 | $1,852 | $35,039 |
Source: Public Records
Map
Nearby Homes
- 460 E Hickory St
- 461 Gina St
- 701 Gina St
- 61 Gina St
- 2940 Viva Place
- 261 E Hickory St
- 160 Fontana St
- 220 Fontana St
- 761 E Jaybird St
- 2640 Rimrock Ave
- 2760 Ponderosa Ave
- 2601 Rimrock Ave
- 2480 Sycamore Ave
- 440 Chevron St
- 3715 E Mount Charleston Dr
- 240 Blackhorn St
- 540 Blackhorn St
- 240 Chevron St
- 901 Laguna St
- 2720 Mariposa Ave
- 501 E Hickory St
- 481 E Hickory St
- 540 Intrepid St
- 500 Intrepid St
- 540 E Hickory St
- 480 Intrepid St
- 581 E Hickory St Unit 4A
- 461 E Hickory St
- 560 E Hickory St
- 480 E Hickory St
- 460 Intrepid St
- 580 E Hickory St
- 441 E Hickory St
- 600 Intrepid St
- 440 Intrepid St
- 541 Gina St
- 501 Intrepid St
- 600 E Hickory St
- 561 Gina St
- 620 Intrepid St
Your Personal Tour Guide
Ask me questions while you tour the home.