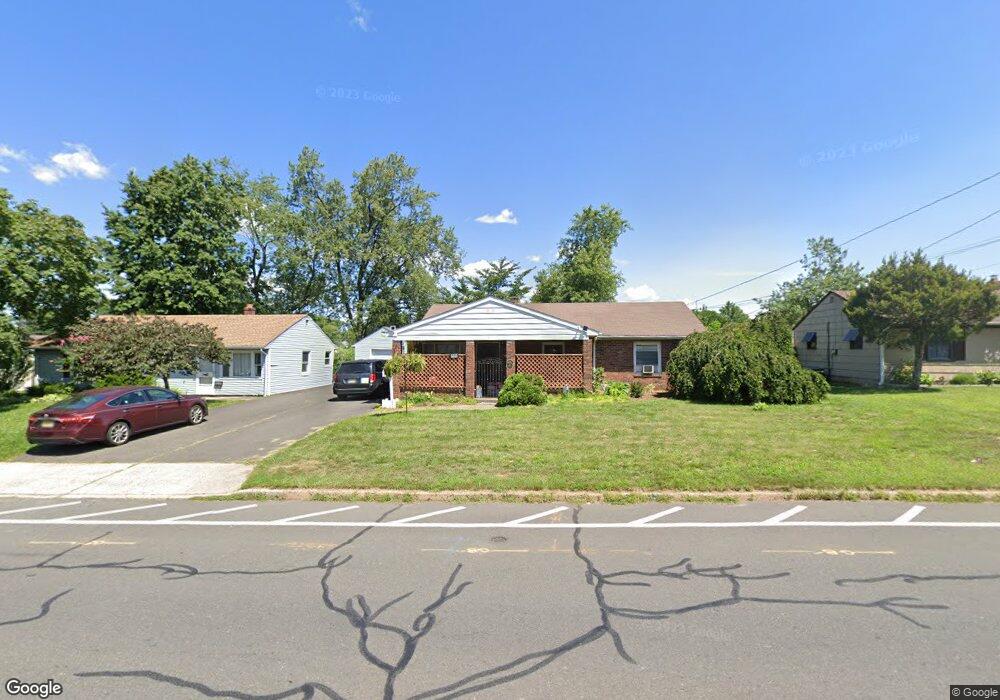
521 E Main St Bridgewater, NJ 08807
Estimated Value: $406,453 - $461,000
Studio
--
Bath
960
Sq Ft
$457/Sq Ft
Est. Value
About This Home
This home is located at 521 E Main St, Bridgewater, NJ 08807 and is currently estimated at $438,863, approximately $457 per square foot. 521 E Main St is a home located in Somerset County with nearby schools including Adamsville Primary School, Bridgewater-Raritan Middle School, and Hillside Intermediate School.
Ownership History
Date
Name
Owned For
Owner Type
Purchase Details
Closed on
Mar 6, 2015
Sold by
Havran Robert
Bought by
Havran Derek and Havran Patricia
Current Estimated Value
Home Financials for this Owner
Home Financials are based on the most recent Mortgage that was taken out on this home.
Original Mortgage
$160,000
Outstanding Balance
$122,499
Interest Rate
3.67%
Mortgage Type
New Conventional
Estimated Equity
$316,364
Create a Home Valuation Report for This Property
The Home Valuation Report is an in-depth analysis detailing your home's value as well as a comparison with similar homes in the area
Home Values in the Area
Average Home Value in this Area
Purchase History
| Date | Buyer | Sale Price | Title Company |
|---|---|---|---|
| Havran Derek | $200,000 | Attorney |
Source: Public Records
Mortgage History
| Date | Status | Borrower | Loan Amount |
|---|---|---|---|
| Open | Havran Derek | $160,000 |
Source: Public Records
Tax History
| Year | Tax Paid | Tax Assessment Tax Assessment Total Assessment is a certain percentage of the fair market value that is determined by local assessors to be the total taxable value of land and additions on the property. | Land | Improvement |
|---|---|---|---|---|
| 2025 | $5,472 | $283,400 | $163,900 | $119,500 |
| 2024 | $5,472 | $277,600 | $163,900 | $113,700 |
Source: Public Records
Map
Nearby Homes
- 548 Bridgewater Ave
- 382 E Main St
- 17 Putnam St
- 622 Desota Dr
- 380 E Main St
- 0 Woodside Ln
- 000 Woodside Ln
- 00 Woodside Ln
- 4 Columbia Dr Unit 1A
- 11 Eastern Ave
- 77 Pearl St
- 6 Dartmouth Ave Unit 4B
- 4 Fairview Ave
- 295 English Ct
- 25 Chelsea Way
- 309 Jamestown Rd
- 1140 Saint John St
- 415 Knopf St
- 1315 Gress St
- 56-58 Hamilton St
Your Personal Tour Guide
Ask me questions while you tour the home.