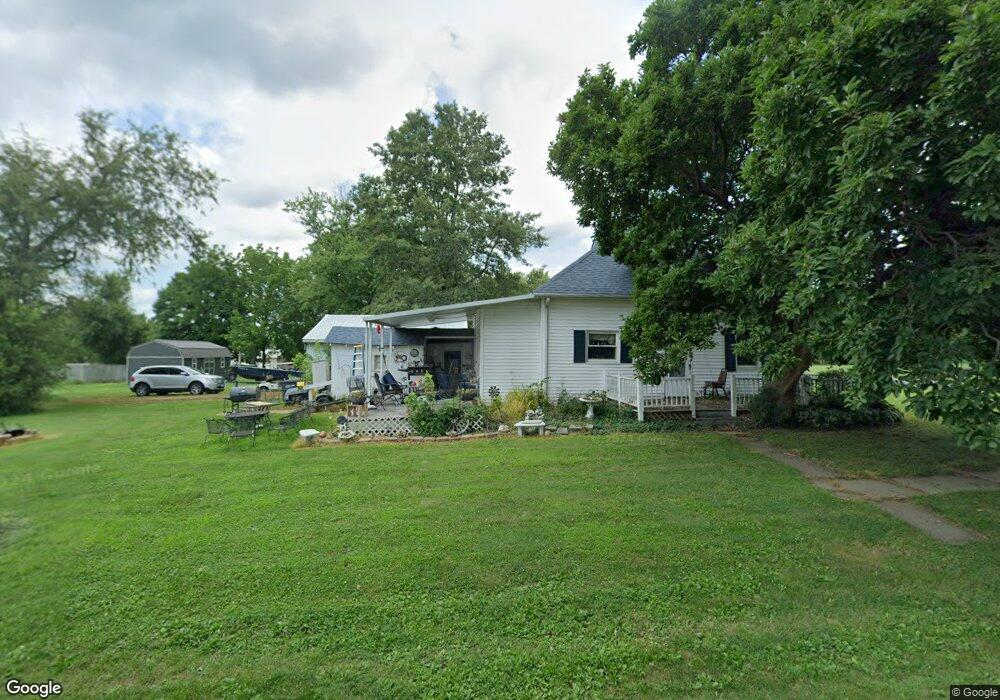
521 E Walnut St Fillmore, IL 62032
Estimated Value: $132,000 - $149,000
Studio
--
Bath
754
Sq Ft
$186/Sq Ft
Est. Value
About This Home
This home is located at 521 E Walnut St, Fillmore, IL 62032 and is currently estimated at $140,500, approximately $186 per square foot. 521 E Walnut St is a home located in Montgomery County with nearby schools including North Elementary School and Nokomis Junior/Senior High School.
Ownership History
Date
Name
Owned For
Owner Type
Purchase Details
Closed on
Sep 30, 2017
Sold by
May James
Bought by
Sampson David and Sampson Dawn
Current Estimated Value
Purchase Details
Closed on
Sep 7, 2017
Sold by
Schweizer William J
Bought by
May James A
Purchase Details
Closed on
Nov 23, 2015
Sold by
Muncy Robert C and Muncy Linda K
Bought by
Schweizer William J
Purchase Details
Closed on
Mar 3, 2008
Sold by
May Larry A and May Phyllis A
Bought by
Muncy Robert C and Muncy Linda K
Create a Home Valuation Report for This Property
The Home Valuation Report is an in-depth analysis detailing your home's value as well as a comparison with similar homes in the area
Purchase History
| Date | Buyer | Sale Price | Title Company |
|---|---|---|---|
| Sampson David | $7,500 | -- | |
| May James A | -- | -- | |
| Schweizer William J | $6,000 | -- | |
| Muncy Robert C | $20,000 | None Available |
Source: Public Records
Tax History
| Year | Tax Paid | Tax Assessment Tax Assessment Total Assessment is a certain percentage of the fair market value that is determined by local assessors to be the total taxable value of land and additions on the property. | Land | Improvement |
|---|---|---|---|---|
| 2024 | $771 | $8,200 | $870 | $7,330 |
| 2023 | $736 | $7,710 | $820 | $6,890 |
| 2022 | $734 | $7,470 | $790 | $6,680 |
| 2021 | $711 | $7,040 | $740 | $6,300 |
| 2020 | $681 | $6,600 | $700 | $5,900 |
| 2019 | $664 | $6,340 | $670 | $5,670 |
| 2018 | $671 | $6,050 | $640 | $5,410 |
| 2017 | $957 | $5,870 | $620 | $5,250 |
| 2016 | $1,236 | $10,500 | $610 | $9,890 |
| 2015 | $1,218 | $10,660 | $620 | $10,040 |
| 2013 | $1,079 | $10,550 | $610 | $9,940 |
Source: Public Records
Map
Nearby Homes
- 10215 Bended Trail
- 456 E 2595 Ave
- 106 Locust St
- TBD Red Ball Trail
- Cr 2950n
- 102 3rd St
- TBD W Main St
- 171 Red Ball Trail
- 694 E 2735 Ave
- 725 S Front St
- 419 S Front St
- 225 E 5th St
- 215 S Pine St
- 836 E 2650 Ave
- Three Miles South of Nokomis
- 425 N Pine St
- 5 Remond St
- 1847 Jaketown Rd
- 638 E Ford Ave
- 111 W Middleton St
- 313 N East St
- 302 N East St
- 217 N East St
- 214 N East St
- 264 E Ave E
- 306 N Richmond St
- 214 N Richmond St
- 312 N Richmond St
- 519 E Pine St
- 200 N East St
- 303 N Richmond St
- 200 N Richmond St
- 418 E Pine St
- 406 N Richmond St
- 421 E North St
- 115 N East St
- 118 N East St
- 403 E North St
- 415 N Richmond St
- 415 N Richmond St
Your Personal Tour Guide
Ask me questions while you tour the home.