Estimated Value: $144,000 - $172,354
4
Beds
2
Baths
1,732
Sq Ft
$90/Sq Ft
Est. Value
About This Home
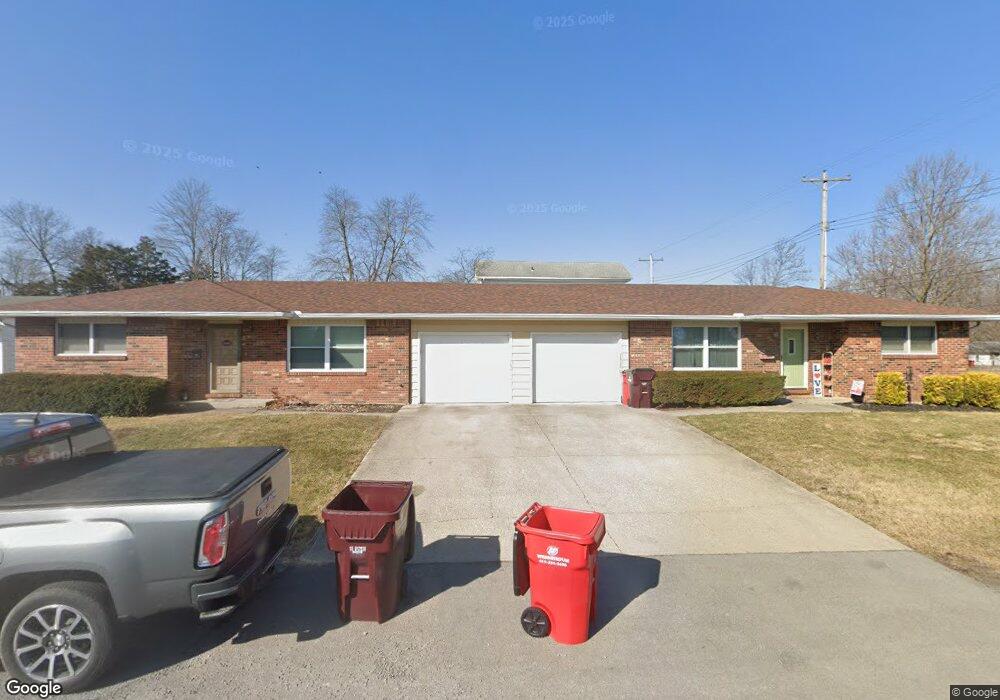
This home is located at 521 Edwards St Unit 523, Ada, OH 45810 and is currently estimated at $155,339, approximately $89 per square foot. 521 Edwards St Unit 523 is a home located in Hardin County with nearby schools including Ada Elementary School and Ada High School.
Ownership History
Date
Name
Owned For
Owner Type
Purchase Details
Closed on
Nov 8, 2024
Sold by
Pandora Properties Llc
Bought by
Jcampbell Rentals Llc
Current Estimated Value
Home Financials for this Owner
Home Financials are based on the most recent Mortgage that was taken out on this home.
Original Mortgage
$123,750
Outstanding Balance
$116,058
Interest Rate
6.08%
Mortgage Type
New Conventional
Estimated Equity
$39,281
Purchase Details
Closed on
May 18, 2012
Sold by
Pitts Aaron L
Bought by
Pandora Properties Llc
Purchase Details
Closed on
Apr 7, 2003
Bought by
Pitts Aaron L Trustee
Purchase Details
Closed on
Sep 17, 1998
Bought by
Pitts Sharon K and Pitts Aaron
Purchase Details
Closed on
Jul 31, 1996
Bought by
Pitts Sharon K
Create a Home Valuation Report for This Property
The Home Valuation Report is an in-depth analysis detailing your home's value as well as a comparison with similar homes in the area
Home Values in the Area
Average Home Value in this Area
Purchase History
| Date | Buyer | Sale Price | Title Company |
|---|---|---|---|
| Jcampbell Rentals Llc | $165,000 | None Listed On Document | |
| Jcampbell Rentals Llc | $165,000 | None Listed On Document | |
| Pandora Properties Llc | $115,000 | None Available | |
| Pitts Aaron L Trustee | -- | -- | |
| Pitts Sharon K | -- | -- | |
| Pitts Sharon K | $47,000 | -- |
Source: Public Records
Mortgage History
| Date | Status | Borrower | Loan Amount |
|---|---|---|---|
| Open | Jcampbell Rentals Llc | $123,750 | |
| Closed | Jcampbell Rentals Llc | $123,750 |
Source: Public Records
Tax History Compared to Growth
Tax History
| Year | Tax Paid | Tax Assessment Tax Assessment Total Assessment is a certain percentage of the fair market value that is determined by local assessors to be the total taxable value of land and additions on the property. | Land | Improvement |
|---|---|---|---|---|
| 2024 | $1,749 | $43,680 | $2,770 | $40,910 |
| 2023 | $1,749 | $43,680 | $2,770 | $40,910 |
| 2022 | $1,493 | $32,470 | $2,670 | $29,800 |
| 2021 | $1,639 | $32,470 | $2,670 | $29,800 |
| 2020 | $1,660 | $32,470 | $2,670 | $29,800 |
| 2019 | $1,490 | $29,400 | $2,550 | $26,850 |
| 2018 | $1,459 | $29,400 | $2,550 | $26,850 |
| 2017 | $1,427 | $29,400 | $2,550 | $26,850 |
| 2016 | $1,721 | $37,530 | $2,470 | $35,060 |
| 2015 | $1,640 | $37,530 | $2,470 | $35,060 |
| 2014 | $1,681 | $37,530 | $2,470 | $35,060 |
| 2013 | $1,864 | $39,610 | $2,470 | $37,140 |
Source: Public Records
Map
Nearby Homes
- 444 Edwards St Unit A, B
- 444 Edwards St Unit 2
- 442 Edwards St
- 629 N Main St
- 128 W North Ave
- 212 N Simon St
- 211 S Main St
- 118 W Buckeye Ave
- 210 N Gilbert St
- 211 W Buckeye Ave Unit 211 1/2
- 308-310 S Simon St
- 301 S Main St
- 314 E University Ave
- 710 S Main St
- 4071 Township Road 35
- 2864 Ohio 309
- 3769 County Road 304
- 3931 County Road 80
- 900 N Front St
- 22694 County Road 12