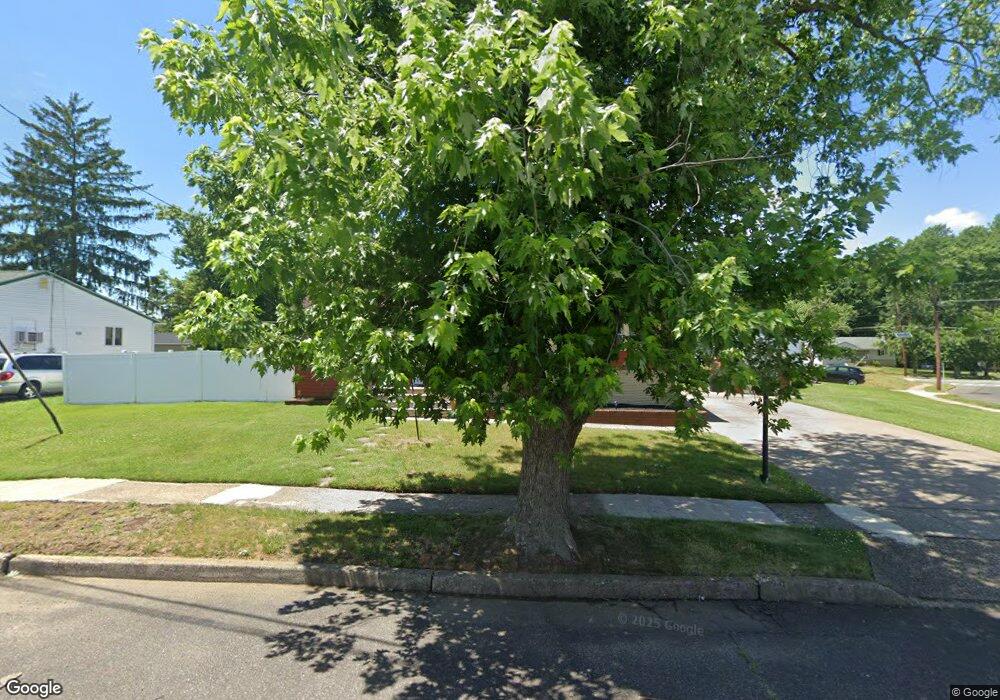
521 Ellen Ln Runnemede, NJ 08078
Estimated Value: $297,182 - $336,000
3
Beds
1
Bath
1,120
Sq Ft
$285/Sq Ft
Est. Value
About This Home
This home is located at 521 Ellen Ln, Runnemede, NJ 08078 and is currently estimated at $319,296, approximately $285 per square foot. 521 Ellen Ln is a home located in Camden County with nearby schools including Mary E. Volz Elementary School, Bingham Elementary School, and Triton High School.
Ownership History
Date
Name
Owned For
Owner Type
Purchase Details
Closed on
Jan 15, 2025
Sold by
Thompson Michael and Harper Demi
Bought by
Thompson Michael and Harper Demi
Current Estimated Value
Home Financials for this Owner
Home Financials are based on the most recent Mortgage that was taken out on this home.
Original Mortgage
$273,504
Outstanding Balance
$271,648
Interest Rate
6.93%
Mortgage Type
FHA
Estimated Equity
$47,648
Purchase Details
Closed on
Jul 2, 2020
Sold by
Dipierro John
Bought by
Thompson Michael and Harper Demi
Home Financials for this Owner
Home Financials are based on the most recent Mortgage that was taken out on this home.
Original Mortgage
$176,739
Interest Rate
3.1%
Mortgage Type
FHA
Purchase Details
Closed on
Dec 20, 2019
Sold by
Wells Fargo Bank National Association
Bought by
Dipierro John
Purchase Details
Closed on
Jun 7, 2019
Sold by
Ault Brenda and State Of New Jersey
Bought by
Wells Fargo Bank Na and Mastr Asset Backed Securities Trusts
Create a Home Valuation Report for This Property
The Home Valuation Report is an in-depth analysis detailing your home's value as well as a comparison with similar homes in the area
Home Values in the Area
Average Home Value in this Area
Purchase History
| Date | Buyer | Sale Price | Title Company |
|---|---|---|---|
| Thompson Michael | -- | None Listed On Document | |
| Thompson Michael | -- | None Listed On Document | |
| Thompson Michael | $180,000 | Surety Title Company | |
| Dipierro John | $92,261 | Group 21 Title Agency Llc | |
| Wells Fargo Bank Na | -- | Lawyers Title Insurance Corp |
Source: Public Records
Mortgage History
| Date | Status | Borrower | Loan Amount |
|---|---|---|---|
| Open | Thompson Michael | $273,504 | |
| Closed | Thompson Michael | $273,504 | |
| Previous Owner | Thompson Michael | $176,739 |
Source: Public Records
Tax History Compared to Growth
Tax History
| Year | Tax Paid | Tax Assessment Tax Assessment Total Assessment is a certain percentage of the fair market value that is determined by local assessors to be the total taxable value of land and additions on the property. | Land | Improvement |
|---|---|---|---|---|
| 2025 | $6,727 | $149,300 | $47,600 | $101,700 |
| 2024 | $6,523 | $149,300 | $47,600 | $101,700 |
| 2023 | $6,523 | $149,300 | $47,600 | $101,700 |
| 2022 | $6,315 | $149,300 | $47,600 | $101,700 |
| 2021 | $6,166 | $149,300 | $47,600 | $101,700 |
| 2020 | $6,105 | $149,300 | $47,600 | $101,700 |
| 2019 | $5,993 | $149,300 | $47,600 | $101,700 |
| 2018 | $5,878 | $149,300 | $47,600 | $101,700 |
| 2017 | $5,727 | $149,300 | $47,600 | $101,700 |
| 2016 | $5,655 | $149,300 | $47,600 | $101,700 |
| 2015 | $5,672 | $149,300 | $47,600 | $101,700 |
| 2014 | $5,599 | $149,300 | $47,600 | $101,700 |
Source: Public Records
Map
Nearby Homes
- 613 Williams Terrace
- 600 Williams Ave
- 688 Dettmar Terrace
- 524 Hirsch Ave
- 850 Orchard Ave
- 206 W 5th Ave
- 115 W 1st Ave
- 211 Broadway
- 37 W 5th Ave
- 21 S Oakland Ave
- 525 W Evesham Rd
- 924 W Evesham Rd
- 27 E 3rd Ave
- 39 E 2nd Ave
- 642 Central Ave
- 37 Whaler Ave
- 41 Whaler Ave
- 43 Whaler Ave
- 45 Whaler Ave
- 47 Whaler Dr