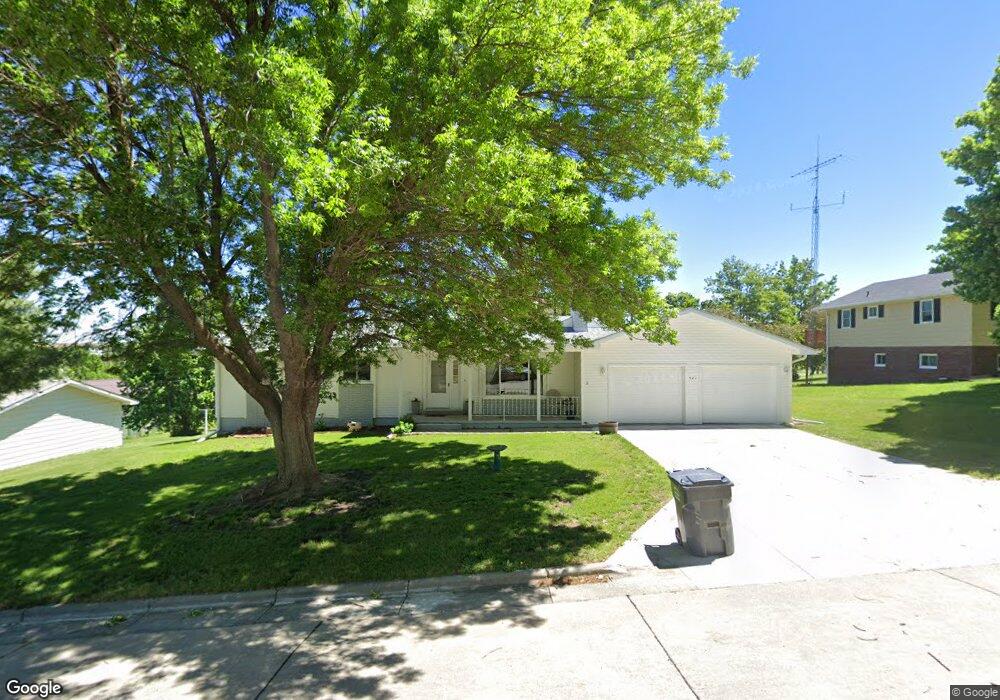
521 Elm St Clarkson, NE 68629
Estimated Value: $147,000 - $227,844
3
Beds
2
Baths
1,384
Sq Ft
$134/Sq Ft
Est. Value
About This Home
This home is located at 521 Elm St, Clarkson, NE 68629 and is currently estimated at $184,961, approximately $133 per square foot. 521 Elm St is a home located in Colfax County with nearby schools including Clarkson Elementary School, Clarkson Junior/Senior High School, and St John Neumann Catholic Elementary School.
Ownership History
Date
Name
Owned For
Owner Type
Purchase Details
Closed on
Oct 23, 2023
Sold by
Plummer Randy S and Plummer Cindy L
Bought by
Plummer Randy S and Plummer Randy S
Current Estimated Value
Purchase Details
Closed on
Oct 10, 2017
Sold by
Seymour Frances E
Bought by
Plummer Randy S and Plummer Cindy L
Home Financials for this Owner
Home Financials are based on the most recent Mortgage that was taken out on this home.
Original Mortgage
$70,800
Interest Rate
3.78%
Mortgage Type
New Conventional
Create a Home Valuation Report for This Property
The Home Valuation Report is an in-depth analysis detailing your home's value as well as a comparison with similar homes in the area
Home Values in the Area
Average Home Value in this Area
Purchase History
| Date | Buyer | Sale Price | Title Company |
|---|---|---|---|
| Plummer Randy S | -- | None Listed On Document | |
| Plummer Randy S | $89,000 | Colfax County Title & Abstra |
Source: Public Records
Mortgage History
| Date | Status | Borrower | Loan Amount |
|---|---|---|---|
| Previous Owner | Plummer Randy S | $70,800 |
Source: Public Records
Tax History Compared to Growth
Tax History
| Year | Tax Paid | Tax Assessment Tax Assessment Total Assessment is a certain percentage of the fair market value that is determined by local assessors to be the total taxable value of land and additions on the property. | Land | Improvement |
|---|---|---|---|---|
| 2024 | $1,941 | $164,235 | $6,225 | $158,010 |
| 2023 | $1,829 | $120,535 | $6,225 | $114,310 |
| 2022 | $1,673 | $104,830 | $6,225 | $98,605 |
| 2021 | $1,442 | $89,595 | $6,225 | $83,370 |
| 2020 | $1,447 | $89,595 | $6,225 | $83,370 |
| 2019 | $1,412 | $88,280 | $4,910 | $83,370 |
| 2018 | $1,480 | $91,900 | $4,910 | $86,990 |
| 2017 | $1,410 | $81,475 | $4,910 | $76,565 |
| 2016 | $0 | $81,475 | $4,910 | $76,565 |
| 2015 | -- | $81,475 | $4,910 | $76,565 |
| 2014 | $25 | $80,810 | $4,910 | $75,900 |
Source: Public Records
Map
Nearby Homes