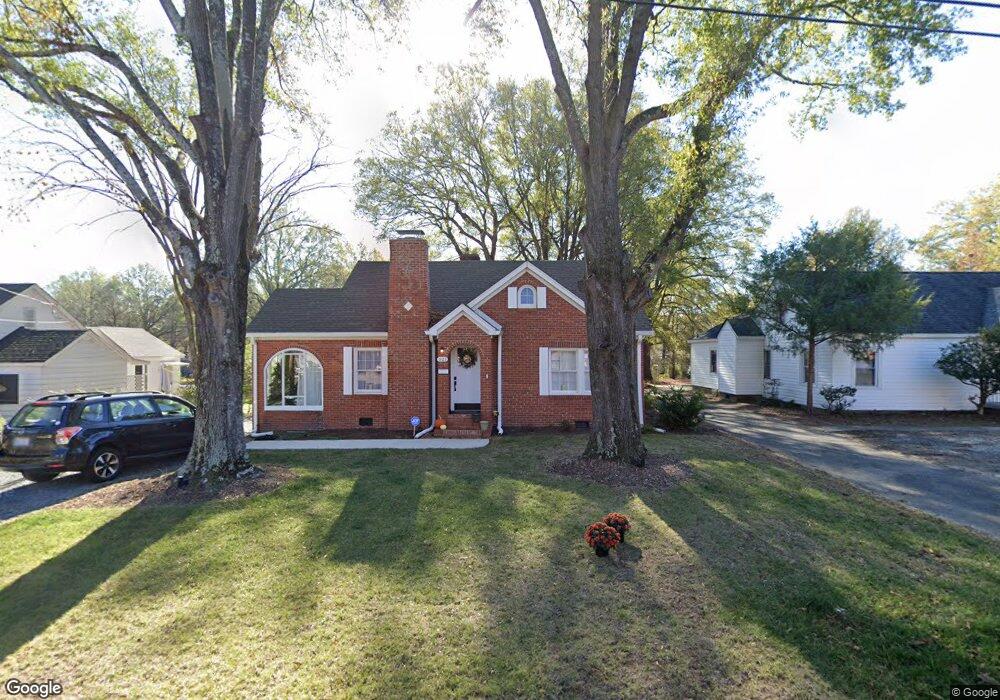
521 Engleside St Unit 3 Monroe, NC 28110
Estimated Value: $269,000 - $293,000
3
Beds
2
Baths
1,188
Sq Ft
$234/Sq Ft
Est. Value
About This Home
This home is located at 521 Engleside St Unit 3, Monroe, NC 28110 and is currently estimated at $278,514, approximately $234 per square foot. 521 Engleside St Unit 3 is a home located in Union County with nearby schools including Walter Bickett Elementary School, Monroe Middle School, and Monroe High School.
Ownership History
Date
Name
Owned For
Owner Type
Purchase Details
Closed on
Dec 21, 2021
Sold by
Rodahaver Matthew Jordan and Rodahaver Claire Ann
Bought by
Moorman Robert and Starzecki Jennifer
Current Estimated Value
Home Financials for this Owner
Home Financials are based on the most recent Mortgage that was taken out on this home.
Original Mortgage
$243,000
Outstanding Balance
$223,526
Interest Rate
3.12%
Mortgage Type
New Conventional
Estimated Equity
$54,988
Purchase Details
Closed on
Aug 4, 2020
Sold by
W3 Resource Management Llc
Bought by
Rodahaver Matthew Jordan and Rodahaver Claire Ann
Home Financials for this Owner
Home Financials are based on the most recent Mortgage that was taken out on this home.
Original Mortgage
$151,000
Interest Rate
3.1%
Mortgage Type
New Conventional
Purchase Details
Closed on
Aug 15, 2019
Sold by
Smith Samantha L
Bought by
W3 Resource Management Llc
Purchase Details
Closed on
Jul 28, 2008
Sold by
Pressley Albrey A
Bought by
Smith Samantha L
Create a Home Valuation Report for This Property
The Home Valuation Report is an in-depth analysis detailing your home's value as well as a comparison with similar homes in the area
Home Values in the Area
Average Home Value in this Area
Purchase History
| Date | Buyer | Sale Price | Title Company |
|---|---|---|---|
| Moorman Robert | $243,000 | None Available | |
| Rodahaver Matthew Jordan | $189,000 | None Available | |
| W3 Resource Management Llc | $99,000 | Chicago Title | |
| Smith Samantha L | -- | None Available |
Source: Public Records
Mortgage History
| Date | Status | Borrower | Loan Amount |
|---|---|---|---|
| Open | Moorman Robert | $243,000 | |
| Previous Owner | Rodahaver Matthew Jordan | $151,000 |
Source: Public Records
Tax History Compared to Growth
Tax History
| Year | Tax Paid | Tax Assessment Tax Assessment Total Assessment is a certain percentage of the fair market value that is determined by local assessors to be the total taxable value of land and additions on the property. | Land | Improvement |
|---|---|---|---|---|
| 2024 | $1,687 | $154,700 | $17,300 | $137,400 |
| 2023 | $1,687 | $154,700 | $17,300 | $137,400 |
| 2022 | $1,687 | $154,700 | $17,300 | $137,400 |
| 2021 | $1,687 | $154,700 | $17,300 | $137,400 |
| 2020 | $398 | $64,620 | $13,420 | $51,200 |
| 2019 | $870 | $64,620 | $13,420 | $51,200 |
| 2018 | $398 | $64,620 | $13,420 | $51,200 |
| 2017 | $883 | $64,600 | $13,400 | $51,200 |
| 2016 | $495 | $64,620 | $13,420 | $51,200 |
| 2015 | $502 | $64,620 | $13,420 | $51,200 |
| 2014 | $1,042 | $85,440 | $15,030 | $70,410 |
Source: Public Records
Map
Nearby Homes
- 508 Engleside St
- 404 King St
- 0 Secrest Shortcut Rd Unit CAR4254431
- 214 W Phifer St
- 1204 Onset Place Unit 27
- 1202 Onset Place Unit 28
- 1201 Onset Place Unit 4
- 1718 Braemar Village Dr
- 1732 Braemar Village Dr
- 1710 Braemar Village Dr
- 1705 Braemar Village Dr
- 1709 Braemar Village Dr
- 1711 Braemar Village Dr
- 1717 Braemar Village Dr
- 1723 Braemar Village Dr
- 1725 Braemar Village Dr
- 1818 Braemar Village Dr
- 1789 Dickerson Blvd
- 000 Crowell St W
- 1601 Martin Luther King jr Blvd Unit 4
- 521 Engleside St
- 523 Engleside St
- 519 Engleside St
- 1307 Westwood St
- 525 Engleside St
- 1306 Spring St
- 1306 Spring St Unit 8
- 514 Engleside St
- 515 Engleside St
- 601 Engleside St
- 520 Engleside St Unit 92
- 1405 Westwood St
- 1304 Spring St
- 1306 Westwood St
- 1305 Spring St
- 606 Engleside St
- 513 Engleside St
- 1304 Westwood St
- 526 Engleside St
- 1402 McDonald St