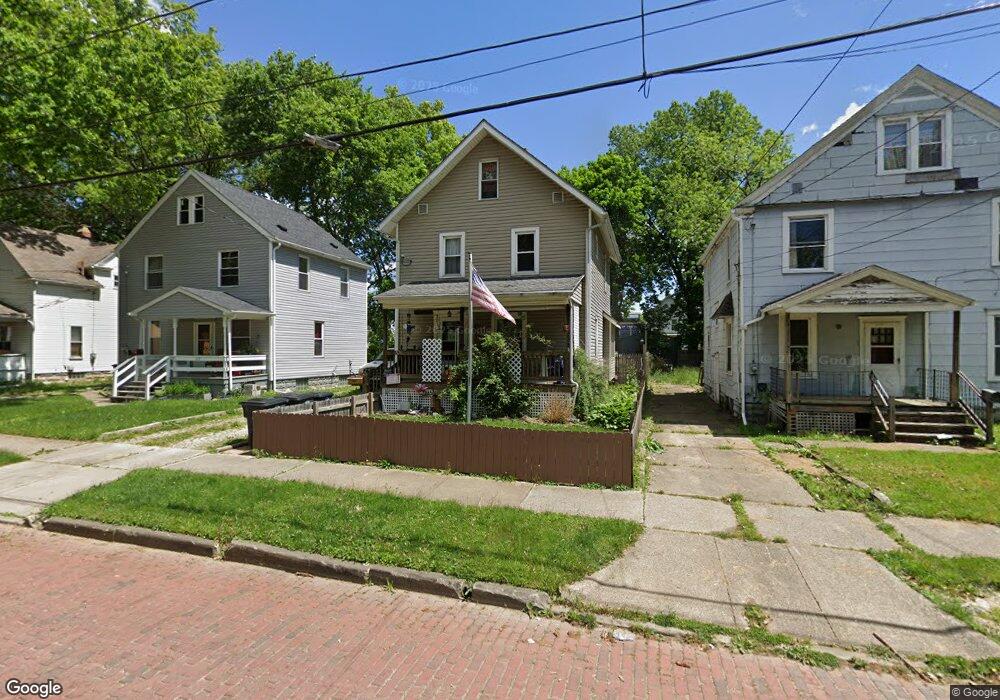
521 Gridley St Akron, OH 44306
Downtown Akron NeighborhoodEstimated Value: $70,000 - $79,000
3
Beds
1
Bath
1,373
Sq Ft
$55/Sq Ft
Est. Value
About This Home
This home is located at 521 Gridley St, Akron, OH 44306 and is currently estimated at $76,137, approximately $55 per square foot. 521 Gridley St is a home located in Summit County with nearby schools including Case Preparatory Academy, Middlebury Academy, and Main Preparatory Academy.
Ownership History
Date
Name
Owned For
Owner Type
Purchase Details
Closed on
Sep 1, 2017
Sold by
Duncan Robert M and Duncan Peggy L
Bought by
Duncan Robert M and Duncan Peggy L
Current Estimated Value
Purchase Details
Closed on
Sep 9, 1999
Sold by
Jones Dorothy J
Bought by
Duncan Robert M and Duncan Peggy I
Home Financials for this Owner
Home Financials are based on the most recent Mortgage that was taken out on this home.
Original Mortgage
$55,200
Interest Rate
7.93%
Purchase Details
Closed on
Sep 16, 1998
Sold by
Jones Edward D
Bought by
Duncan Robert M Peggy I
Create a Home Valuation Report for This Property
The Home Valuation Report is an in-depth analysis detailing your home's value as well as a comparison with similar homes in the area
Home Values in the Area
Average Home Value in this Area
Purchase History
| Date | Buyer | Sale Price | Title Company |
|---|---|---|---|
| Duncan Robert M | -- | None Available | |
| Duncan Robert M | $27,000 | Prospect Title Agency Inc | |
| Duncan Robert M Peggy I | $27,000 | -- |
Source: Public Records
Mortgage History
| Date | Status | Borrower | Loan Amount |
|---|---|---|---|
| Previous Owner | Duncan Robert M | $55,200 |
Source: Public Records
Tax History Compared to Growth
Tax History
| Year | Tax Paid | Tax Assessment Tax Assessment Total Assessment is a certain percentage of the fair market value that is determined by local assessors to be the total taxable value of land and additions on the property. | Land | Improvement |
|---|---|---|---|---|
| 2025 | $844 | $15,012 | $3,553 | $11,459 |
| 2024 | $844 | $15,012 | $3,553 | $11,459 |
| 2023 | $844 | $15,012 | $3,553 | $11,459 |
| 2022 | $781 | $10,819 | $2,450 | $8,369 |
| 2021 | $781 | $10,819 | $2,450 | $8,369 |
| 2020 | $770 | $10,820 | $2,450 | $8,370 |
| 2019 | $1,062 | $13,950 | $4,140 | $9,810 |
| 2018 | $1,048 | $13,950 | $4,140 | $9,810 |
| 2017 | $1,077 | $13,950 | $4,140 | $9,810 |
| 2016 | $1,078 | $14,140 | $4,140 | $10,000 |
| 2015 | $1,077 | $14,140 | $4,140 | $10,000 |
| 2014 | $1,069 | $14,140 | $4,140 | $10,000 |
| 2013 | $1,101 | $14,910 | $4,140 | $10,770 |
Source: Public Records
Map
Nearby Homes