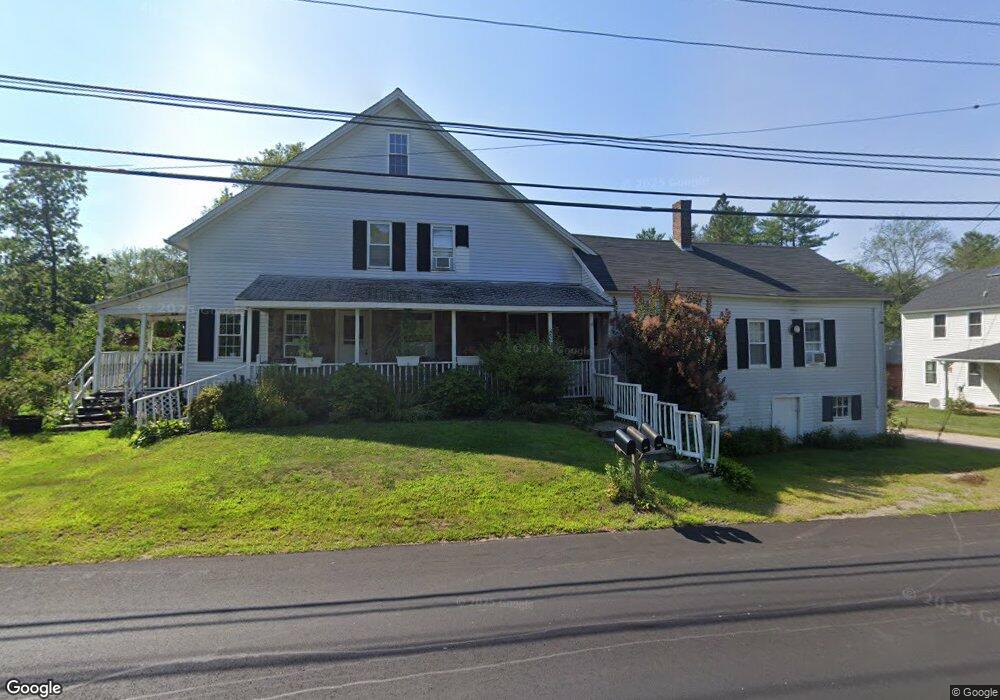
521 Hampton Rd Abington, CT 06230
Estimated Value: $283,000 - $338,000
2
Beds
4
Baths
1,518
Sq Ft
$199/Sq Ft
Est. Value
About This Home
This home is located at 521 Hampton Rd, Abington, CT 06230 and is currently estimated at $302,808, approximately $199 per square foot. 521 Hampton Rd is a home located in Windham County with nearby schools including Pomfret Community School, Rectory School, and Pomfret School.
Ownership History
Date
Name
Owned For
Owner Type
Purchase Details
Closed on
Aug 23, 2021
Sold by
Amberg Hm & Rentals Llc
Bought by
Deyoung Terrance J
Current Estimated Value
Home Financials for this Owner
Home Financials are based on the most recent Mortgage that was taken out on this home.
Original Mortgage
$232,750
Outstanding Balance
$211,001
Interest Rate
2.7%
Mortgage Type
Stand Alone Refi Refinance Of Original Loan
Estimated Equity
$91,807
Purchase Details
Closed on
Oct 1, 2020
Sold by
Harris Christine A
Bought by
Amberg Home & Rentals Llc
Purchase Details
Closed on
Nov 16, 1998
Sold by
Slye Phoebe F Est
Bought by
Harris Christine A
Home Financials for this Owner
Home Financials are based on the most recent Mortgage that was taken out on this home.
Original Mortgage
$60,000
Interest Rate
6.88%
Mortgage Type
Purchase Money Mortgage
Create a Home Valuation Report for This Property
The Home Valuation Report is an in-depth analysis detailing your home's value as well as a comparison with similar homes in the area
Home Values in the Area
Average Home Value in this Area
Purchase History
| Date | Buyer | Sale Price | Title Company |
|---|---|---|---|
| Deyoung Terrance J | -- | None Available | |
| Deyoung Terrance J | -- | None Available | |
| Amberg Home & Rentals Llc | $93,000 | None Available | |
| Amberg Home & Rentals Llc | $93,000 | None Available | |
| Harris Christine A | $55,000 | -- | |
| Harris Christine A | $55,000 | -- |
Source: Public Records
Mortgage History
| Date | Status | Borrower | Loan Amount |
|---|---|---|---|
| Open | Deyoung Terrance J | $232,750 | |
| Closed | Deyoung Terrance J | $232,750 | |
| Previous Owner | Harris Christine A | $60,000 |
Source: Public Records
Tax History Compared to Growth
Tax History
| Year | Tax Paid | Tax Assessment Tax Assessment Total Assessment is a certain percentage of the fair market value that is determined by local assessors to be the total taxable value of land and additions on the property. | Land | Improvement |
|---|---|---|---|---|
| 2025 | $3,626 | $174,900 | $30,900 | $144,000 |
| 2024 | $4,359 | $103,100 | $29,400 | $73,700 |
| 2023 | $2,758 | $103,100 | $29,400 | $73,700 |
| 2022 | $2,757 | $103,100 | $29,400 | $73,700 |
| 2021 | $2,733 | $103,100 | $29,400 | $73,700 |
| 2020 | $2,875 | $104,100 | $28,100 | $76,000 |
| 2019 | $2,829 | $104,100 | $28,100 | $76,000 |
| 2018 | $2,800 | $104,100 | $28,100 | $76,000 |
| 2017 | $3,012 | $104,100 | $28,100 | $76,000 |
| 2016 | $2,665 | $104,100 | $28,100 | $76,000 |
| 2015 | $2,847 | $112,800 | $42,400 | $70,400 |
| 2014 | $2,835 | $112,800 | $42,400 | $70,400 |
Source: Public Records
Map
Nearby Homes
- 00 Mashamoquet Rd
- 834 Hampton Rd
- 815 Mashamoquet Rd
- 1 Jericho Rd
- 97 Blossom Dr
- 933 Hampton Rd
- 0 Jericho Rd
- 180 Jericho Rd
- 204 Paine Rd
- 80 Averill Rd
- 455 Brayman Hollow Rd
- 338 Brooklyn Rd
- 698 Brayman Hollow Rd
- 357 Wrights Crossing Rd
- 0 Boston Turnpike
- 48 Wrights Crossing Rd
- 30 Tyrone Rd
- 150 Searles Rd
- 127 Windy Hill Rd
- 242 Herrick Rd
- 519 Hampton Rd
- 519 Hampton Rd
- 534 Hampton Rd
- 530 Hampton Rd
- 535 Hampton Rd
- 806 Hampton Rd
- 535 Hampton Rd
- 535 Hampton Rd
- 515 Hampton Rd
- 532 Mashamoquet Rd
- 85, 77 Fire Tower Rd
- 570 Hampton Rd
- 547 Hampton Rd
- 556 Hampton Rd
- 489 Hampton Rd
- 485 Hampton Rd
- 524 Mashamoquet Rd
- 551 Hampton Rd
- 000 Mashamoquet Rd
- 514 Mashamoquet Rd