Estimated Value: $715,000 - $743,000
4
Beds
3
Baths
2,462
Sq Ft
$295/Sq Ft
Est. Value
About This Home
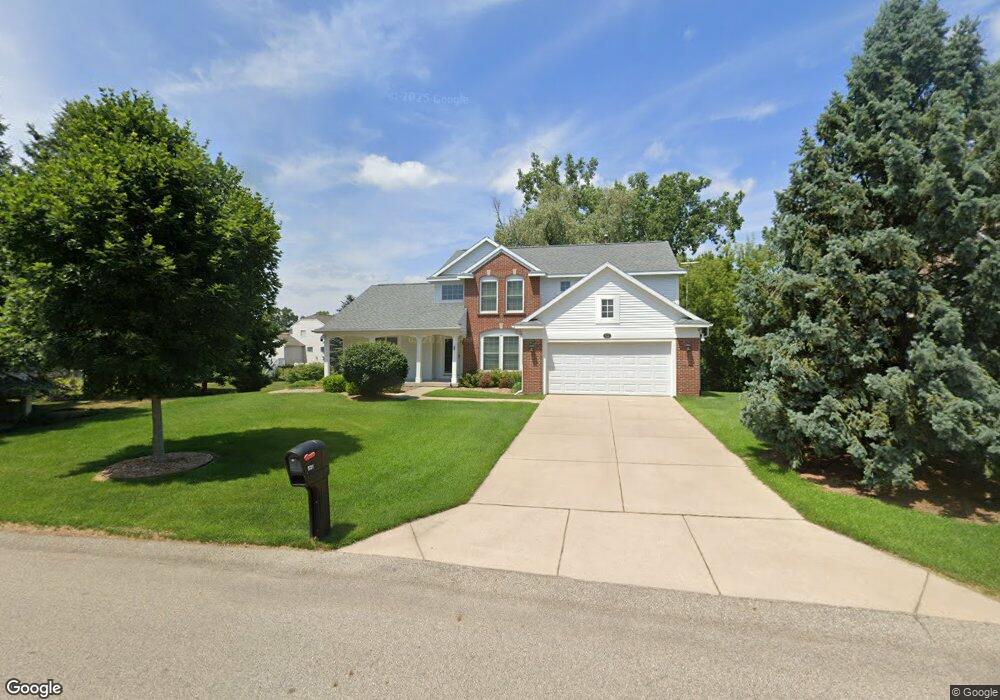
This home is located at 521 Hartfield Dr SE Unit 52, Ada, MI 49301 and is currently estimated at $727,073, approximately $295 per square foot. 521 Hartfield Dr SE Unit 52 is a home located in Kent County with nearby schools including Ada Elementary School, Central Woodlands 5/6 School, and Central Middle School.
Ownership History
Date
Name
Owned For
Owner Type
Purchase Details
Closed on
May 29, 2003
Sold by
Frederick John J and Frederick Marcia L
Bought by
Rodegheiro Charles and Rodegheiro Kathleen
Current Estimated Value
Home Financials for this Owner
Home Financials are based on the most recent Mortgage that was taken out on this home.
Original Mortgage
$262,000
Interest Rate
5.78%
Mortgage Type
Purchase Money Mortgage
Purchase Details
Closed on
Feb 25, 2000
Bought by
Morse Steve A and Deming Richard L
Purchase Details
Closed on
Sep 24, 1999
Bought by
Eastbrook Builders Inc and Rodegheiro Charles
Purchase Details
Closed on
Oct 22, 1998
Bought by
M&B Investments Llc and Rodegheiro Charles
Purchase Details
Closed on
Oct 5, 1998
Bought by
Eastbrook Development Company and Rodegheiro Charles
Create a Home Valuation Report for This Property
The Home Valuation Report is an in-depth analysis detailing your home's value as well as a comparison with similar homes in the area
Home Values in the Area
Average Home Value in this Area
Purchase History
| Date | Buyer | Sale Price | Title Company |
|---|---|---|---|
| Rodegheiro Charles | $327,500 | Fatic | |
| Morse Steve A | $279,500 | -- | |
| Eastbrook Builders Inc | -- | -- | |
| M&B Investments Llc | $323,300 | -- | |
| Eastbrook Development Company | $230,900 | -- |
Source: Public Records
Mortgage History
| Date | Status | Borrower | Loan Amount |
|---|---|---|---|
| Closed | Rodegheiro Charles | $262,000 |
Source: Public Records
Tax History Compared to Growth
Tax History
| Year | Tax Paid | Tax Assessment Tax Assessment Total Assessment is a certain percentage of the fair market value that is determined by local assessors to be the total taxable value of land and additions on the property. | Land | Improvement |
|---|---|---|---|---|
| 2025 | $4,130 | $307,500 | $0 | $0 |
| 2024 | $4,130 | $279,300 | $0 | $0 |
| 2023 | $5,995 | $262,200 | $0 | $0 |
| 2022 | $5,808 | $237,600 | $0 | $0 |
| 2021 | $5,586 | $225,100 | $0 | $0 |
| 2020 | $3,688 | $207,500 | $0 | $0 |
| 2019 | $5,064 | $203,200 | $0 | $0 |
| 2018 | $5,266 | $197,100 | $0 | $0 |
| 2017 | $5,249 | $177,100 | $0 | $0 |
| 2016 | $5,064 | $168,400 | $0 | $0 |
| 2015 | -- | $168,400 | $0 | $0 |
| 2013 | -- | $160,800 | $0 | $0 |
Source: Public Records
Map
Nearby Homes
- 495 W Abbey Mill Dr SE
- 645 Abbey Mill Dr SE
- 5479 Ada Dr SE
- 868 Bridge Walk Ct SE Unit 85
- 804 Meadowmeade Dr SE
- 77 Landall Ln SE
- 5505 Fulton St E
- 86 Carl Dr NE
- 6040 Adacroft Dr SE
- 101 Carl Dr NE
- 1000 Ada Place Dr SE
- VL/60 Ada Hills Dr
- 60 Ada Hills Dr
- 60 Alta Dale Ave NE
- 6289 Scarborough Dr SE
- 6050 Grand River Dr NE
- 6300 Redington Ct SE
- 320 Sycamore Way Dr SE Unit 18
- 4972 Luxemburg St SE Unit 8
- 6375 Duxbury Dr SE
- 515 Hartfield Dr SE
- 580 Longwood Dr SE
- 572 Longwood Dr SE Unit 249
- 564 Longwood Dr SE
- 512 Hartfield Dr SE
- 512 Hartfield Dr SE Unit 44
- 524 Hartfield Dr SE Unit 45
- 552 Longwood Dr SE
- 500 Hartfield Dr SE Unit 43
- 503 Hartfield Dr SE Unit 55
- 530 Hartfield Dr SE Unit 46
- 563 N Whitman Ct SE Unit 60
- 546 Longwood Dr SE Unit 246
- 577 Longwood Dr SE
- 538 Hartfield Dr SE Unit 47
- 571 N Whitman Ct SE Unit 59
- 5468 Longwood Ct SE Unit 214
- 573 Longwood Dr SE Unit 212
- 491 Hartfield Dr SE Unit 56
- 538 Longwood Dr SE Unit 245