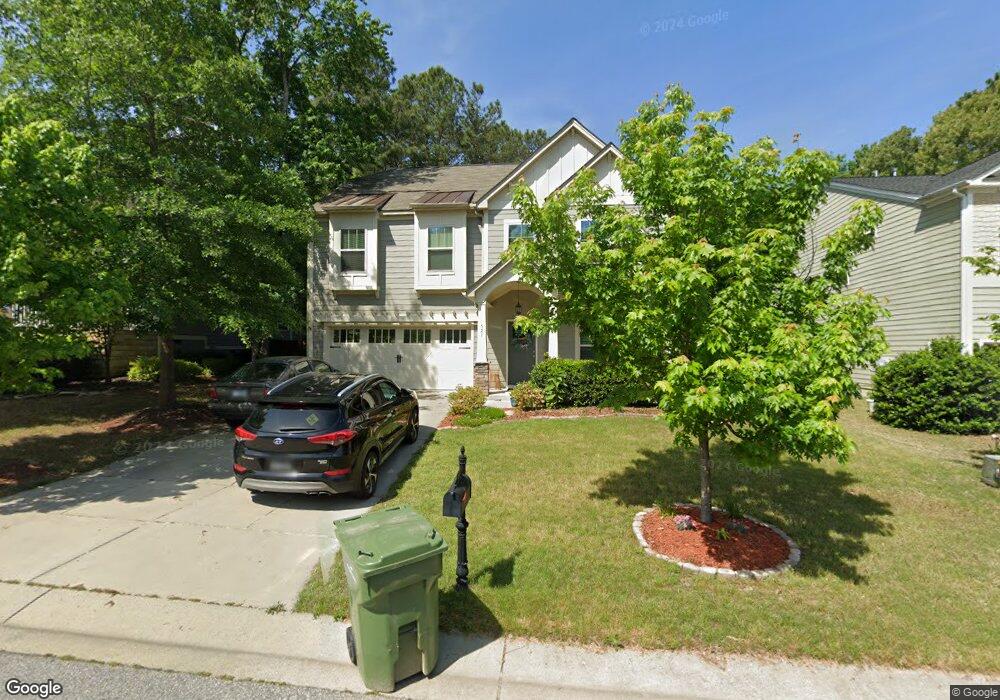
521 Highrock Lake Rd Unit 244 Fuquay Varina, NC 27526
Estimated Value: $482,000 - $508,000
4
Beds
3
Baths
2,363
Sq Ft
$209/Sq Ft
Est. Value
About This Home
This home is located at 521 Highrock Lake Rd Unit 244, Fuquay Varina, NC 27526 and is currently estimated at $494,774, approximately $209 per square foot. 521 Highrock Lake Rd Unit 244 is a home located in Wake County with nearby schools including Carolina Charter Academy.
Ownership History
Date
Name
Owned For
Owner Type
Purchase Details
Closed on
Mar 18, 2021
Sold by
Jones Brittany Thomas and Jones Andrew Christian
Bought by
Stopp Michael W and Kim Imkyoung
Current Estimated Value
Home Financials for this Owner
Home Financials are based on the most recent Mortgage that was taken out on this home.
Original Mortgage
$288,000
Outstanding Balance
$258,607
Interest Rate
2.8%
Mortgage Type
New Conventional
Estimated Equity
$236,167
Purchase Details
Closed on
Feb 14, 2014
Sold by
D R Horton Inc
Bought by
Thomas Brittany Nichole
Home Financials for this Owner
Home Financials are based on the most recent Mortgage that was taken out on this home.
Original Mortgage
$182,400
Interest Rate
4.56%
Mortgage Type
New Conventional
Purchase Details
Closed on
Dec 1, 2010
Sold by
Ipg South Lakes Llc
Bought by
South Lakes Investors Llc
Create a Home Valuation Report for This Property
The Home Valuation Report is an in-depth analysis detailing your home's value as well as a comparison with similar homes in the area
Home Values in the Area
Average Home Value in this Area
Purchase History
| Date | Buyer | Sale Price | Title Company |
|---|---|---|---|
| Stopp Michael W | $360,000 | None Available | |
| Stopp Michael W | $360,000 | None Listed On Document | |
| Thomas Brittany Nichole | $228,000 | None Available | |
| South Lakes Investors Llc | $7,210,000 | None Available |
Source: Public Records
Mortgage History
| Date | Status | Borrower | Loan Amount |
|---|---|---|---|
| Open | Stopp Michael W | $288,000 | |
| Closed | Stopp Michael W | $288,000 | |
| Previous Owner | Thomas Brittany Nichole | $182,400 |
Source: Public Records
Tax History Compared to Growth
Tax History
| Year | Tax Paid | Tax Assessment Tax Assessment Total Assessment is a certain percentage of the fair market value that is determined by local assessors to be the total taxable value of land and additions on the property. | Land | Improvement |
|---|---|---|---|---|
| 2025 | $3,885 | $441,694 | $100,000 | $341,694 |
| 2024 | $3,869 | $441,694 | $100,000 | $341,694 |
| 2023 | $3,213 | $287,143 | $42,000 | $245,143 |
| 2022 | $3,019 | $287,143 | $42,000 | $245,143 |
| 2021 | $2,877 | $287,143 | $42,000 | $245,143 |
| 2020 | $1,926 | $287,143 | $42,000 | $245,143 |
| 2019 | $2,704 | $232,753 | $45,000 | $187,753 |
| 2018 | $2,550 | $232,753 | $45,000 | $187,753 |
| 2017 | $2,458 | $232,753 | $45,000 | $187,753 |
| 2016 | $2,424 | $232,753 | $45,000 | $187,753 |
| 2015 | $2,186 | $216,708 | $54,000 | $162,708 |
| 2014 | $2,107 | $216,708 | $54,000 | $162,708 |
Source: Public Records
Map
Nearby Homes
- 2709 Banks Lake Ct
- 420 Apalachia Lake Dr
- 637 Lake Artesia Ln
- 521 Lake Gaston Dr
- 639 Ashe Lake Way
- 719 Shoals Lake Dr
- 2933 Lake James Dr
- 2942 Wilkes Lake Dr
- 2405 Heathland Farm Dr
- 858 Lake Artesia Ln
- 3408 Apple Meadow Dr
- 515 Glenville Lake Dr
- 112 Wilbur Lake Dr
- 3409 Bennyfield Ct
- 2716 Rindlewood Ct
- 3301 Cobham Ct
- 101 Boone Lake Way
- 3509 Bailey Lake Dr
- 3316 Jones Lake Rd
- 417 Long Lake Dr
- 521 Highrock Lake Rd
- 525 Highrock Lake Rd
- 525 Highrock Lake Rd Unit 243
- 517 Highrock Lake Rd
- 513 Highrock Lake Rd
- 529 Highrock Lake Rd
- 2700 2700 Banks Lake Ct
- 509 Highrock Lake Rd Unit 247
- 509 Highrock Lake Rd
- 524 Highrock Lake Rd Unit 268
- 524 Highrock Lake Rd
- 533 Highrock Lake Rd
- 2704 Banks Lake Ct
- 530 Highrock Lake Rd
- 505 Highrock Lake Rd Unit 248
- 505 Highrock Lake Rd
- 2701 Banks Lake Ct
- 2701 Banks Lake Ct Unit LT262
- 534 Highrock Lake Rd
- 2708 Banks Lake Ct