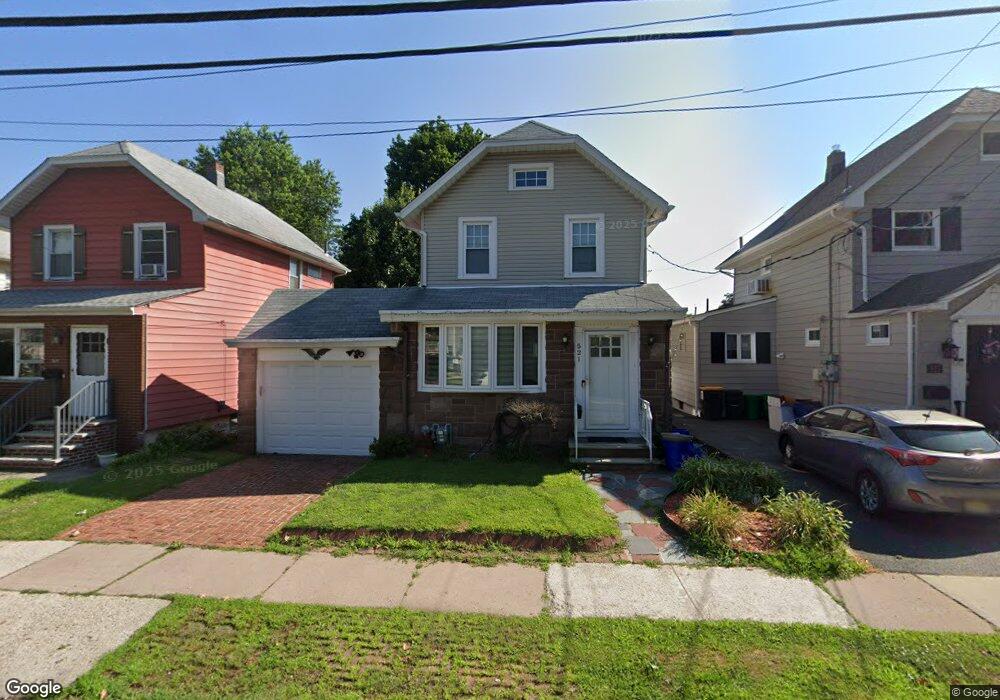
521 Jauncey Ave Lyndhurst, NJ 07071
Estimated Value: $573,333 - $637,000
2
Beds
1
Bath
1,112
Sq Ft
$538/Sq Ft
Est. Value
About This Home
This home is located at 521 Jauncey Ave, Lyndhurst, NJ 07071 and is currently estimated at $597,833, approximately $537 per square foot. 521 Jauncey Ave is a home located in Bergen County with nearby schools including Lyndhurst High School, Sacred Heart School, and Queen Of Peace Grammar School.
Ownership History
Date
Name
Owned For
Owner Type
Purchase Details
Closed on
Mar 20, 2018
Sold by
521 Jauncey Llc
Bought by
Courte Kyle and Alarcon Jessica
Current Estimated Value
Purchase Details
Closed on
Jun 26, 2017
Sold by
Wenz Carol
Bought by
521 Jauncey Llc
Purchase Details
Closed on
Dec 19, 2008
Sold by
Wenz Wenz Carol Lynn Carol Lynn and Wenz Lillian Marie
Bought by
Wenz Carol Lynn
Create a Home Valuation Report for This Property
The Home Valuation Report is an in-depth analysis detailing your home's value as well as a comparison with similar homes in the area
Home Values in the Area
Average Home Value in this Area
Purchase History
| Date | Buyer | Sale Price | Title Company |
|---|---|---|---|
| Courte Kyle | $342,500 | -- | |
| 521 Jauncey Llc | $185,000 | None Available | |
| Wenz Carol Lynn | -- | -- |
Source: Public Records
Tax History Compared to Growth
Tax History
| Year | Tax Paid | Tax Assessment Tax Assessment Total Assessment is a certain percentage of the fair market value that is determined by local assessors to be the total taxable value of land and additions on the property. | Land | Improvement |
|---|---|---|---|---|
| 2025 | $10,180 | $496,900 | $292,000 | $204,900 |
| 2024 | $9,811 | $488,000 | $285,400 | $202,600 |
| 2023 | $9,557 | $482,800 | $282,500 | $200,300 |
| 2022 | $9,557 | $301,300 | $151,800 | $149,500 |
| 2021 | $9,160 | $301,300 | $151,800 | $149,500 |
| 2020 | $8,961 | $301,300 | $151,800 | $149,500 |
| 2019 | $8,894 | $301,300 | $151,800 | $149,500 |
| 2018 | $7,910 | $265,800 | $151,800 | $114,000 |
| 2017 | $7,711 | $265,800 | $151,800 | $114,000 |
| 2016 | $7,538 | $265,800 | $151,800 | $114,000 |
| 2015 | $7,302 | $265,800 | $151,800 | $114,000 |
| 2014 | $7,206 | $265,800 | $151,800 | $114,000 |
Source: Public Records
Map
Nearby Homes