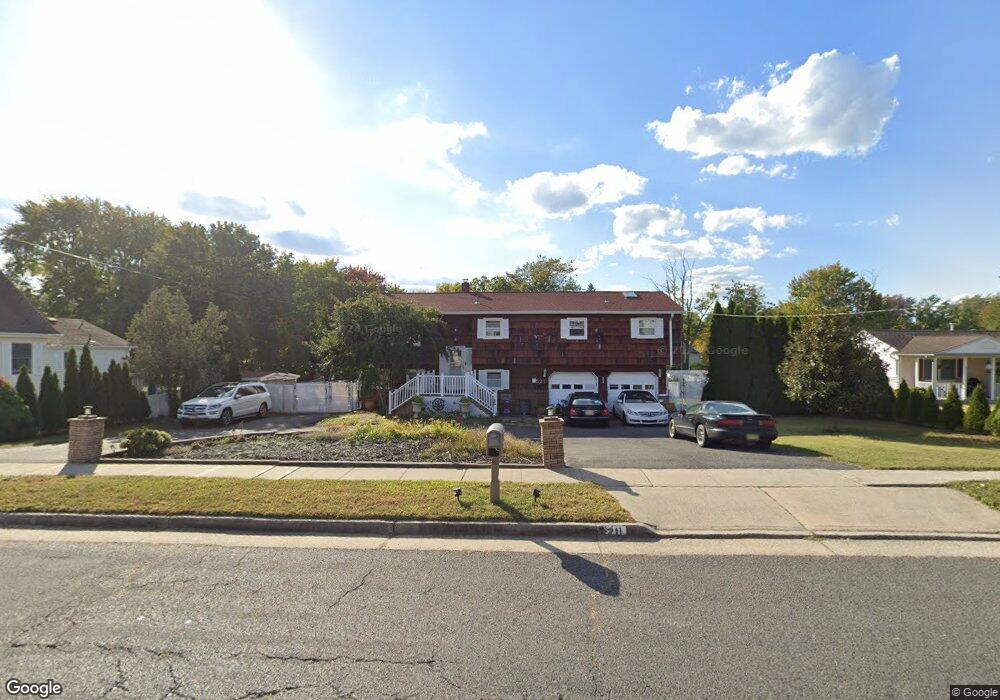
521 Line Rd Matawan, NJ 07747
Estimated Value: $681,000 - $741,976
4
Beds
3
Baths
2,214
Sq Ft
$323/Sq Ft
Est. Value
About This Home
This home is located at 521 Line Rd, Matawan, NJ 07747 and is currently estimated at $715,994, approximately $323 per square foot. 521 Line Rd is a home located in Monmouth County with nearby schools including Matawan Reg High School, St Benedict School, and St. Joseph Elementary School.
Ownership History
Date
Name
Owned For
Owner Type
Purchase Details
Closed on
Aug 22, 2005
Sold by
Canovic Rifat
Bought by
Canovic Dzevat and Canovic Mersiha
Current Estimated Value
Purchase Details
Closed on
Jun 6, 2005
Sold by
Abdelrazek Mohamed H
Bought by
Canovic Rifat and Canovic Rabije
Purchase Details
Closed on
Nov 30, 2001
Sold by
Mirante Ronald
Bought by
Abdelrazek Mohamed and Abdelrazek Habiba
Home Financials for this Owner
Home Financials are based on the most recent Mortgage that was taken out on this home.
Original Mortgage
$239,200
Interest Rate
7.08%
Create a Home Valuation Report for This Property
The Home Valuation Report is an in-depth analysis detailing your home's value as well as a comparison with similar homes in the area
Home Values in the Area
Average Home Value in this Area
Purchase History
| Date | Buyer | Sale Price | Title Company |
|---|---|---|---|
| Canovic Dzevat | -- | -- | |
| Canovic Rifat | $410,000 | -- | |
| Abdelrazek Mohamed | $299,900 | -- | |
| Abdelrazek Mohamed | $299,900 | -- |
Source: Public Records
Mortgage History
| Date | Status | Borrower | Loan Amount |
|---|---|---|---|
| Previous Owner | Abdelrazek Mohamed | $239,200 |
Source: Public Records
Tax History Compared to Growth
Tax History
| Year | Tax Paid | Tax Assessment Tax Assessment Total Assessment is a certain percentage of the fair market value that is determined by local assessors to be the total taxable value of land and additions on the property. | Land | Improvement |
|---|---|---|---|---|
| 2025 | $10,020 | $541,800 | $309,900 | $231,900 |
| 2024 | $9,914 | $495,800 | $268,100 | $227,700 |
| 2023 | $9,914 | $463,500 | $241,100 | $222,400 |
| 2022 | $8,606 | $431,800 | $201,200 | $230,600 |
| 2021 | $8,606 | $353,200 | $148,100 | $205,100 |
| 2020 | $10,756 | $396,300 | $195,800 | $200,500 |
| 2019 | $10,799 | $386,500 | $187,200 | $199,300 |
| 2018 | $10,451 | $375,000 | $185,000 | $190,000 |
| 2017 | $10,561 | $384,300 | $187,700 | $196,600 |
| 2016 | $9,800 | $372,200 | $180,500 | $191,700 |
| 2015 | $10,215 | $372,400 | $171,500 | $200,900 |
| 2014 | $9,765 | $363,000 | $163,400 | $199,600 |
Source: Public Records
Map
Nearby Homes
- 479 Line Rd
- 2 Avondale Ln
- 17 Cavan Ln
- 46 Hyer Ct
- 101 Cresci Blvd
- 149 Idlewild Ln
- 47 Cresci Blvd
- 30 Briscoe Terrace
- 70 Northland Ln
- 40 North Cir
- 11 Mallard St
- 23 Carol Ln
- 672 N Beers St
- 32 Lake Blvd
- 36 Parkview Dr
- 46 Parkview Dr
- 10 7th St
- 627 Beers St
- 12 S Atlantic Ave Unit 14
- 555 S Atlantic Ave Unit 6