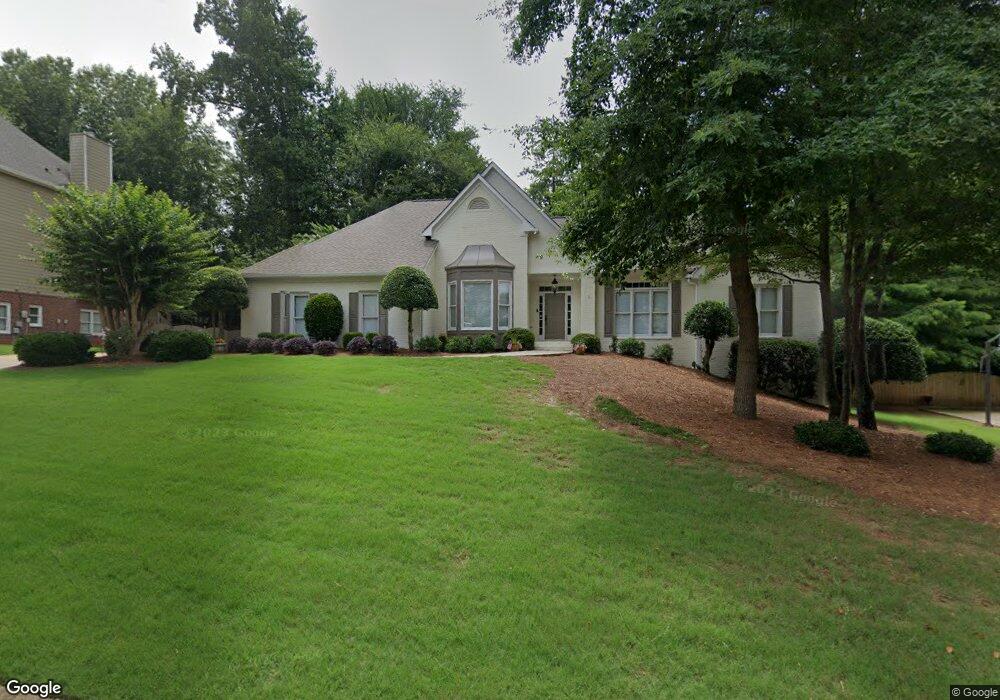
521 Linley Trace Lawrenceville, GA 30043
Estimated Value: $580,113 - $692,000
3
Beds
3
Baths
2,491
Sq Ft
$257/Sq Ft
Est. Value
About This Home
This home is located at 521 Linley Trace, Lawrenceville, GA 30043 and is currently estimated at $639,528, approximately $256 per square foot. 521 Linley Trace is a home located in Gwinnett County with nearby schools including Rock Springs Elementary School, Creekland Middle School, and Collins Hill High School.
Ownership History
Date
Name
Owned For
Owner Type
Purchase Details
Closed on
Apr 27, 2007
Sold by
Walters Randall D
Bought by
Mcfarland Daniel T and Mcfarland Constance L
Current Estimated Value
Home Financials for this Owner
Home Financials are based on the most recent Mortgage that was taken out on this home.
Original Mortgage
$280,000
Outstanding Balance
$169,850
Interest Rate
6.12%
Mortgage Type
New Conventional
Estimated Equity
$469,678
Purchase Details
Closed on
Dec 20, 2001
Sold by
Walters Randall D
Bought by
Walters Randall D and Walters Marsha L
Purchase Details
Closed on
Sep 21, 2001
Sold by
Pape Karen T and Pape Joseph H
Bought by
Walters Randall D
Home Financials for this Owner
Home Financials are based on the most recent Mortgage that was taken out on this home.
Original Mortgage
$304,000
Interest Rate
7%
Mortgage Type
New Conventional
Purchase Details
Closed on
Dec 15, 1995
Sold by
John Wielands Homes
Bought by
Pope Joseph M Karen T
Create a Home Valuation Report for This Property
The Home Valuation Report is an in-depth analysis detailing your home's value as well as a comparison with similar homes in the area
Home Values in the Area
Average Home Value in this Area
Purchase History
| Date | Buyer | Sale Price | Title Company |
|---|---|---|---|
| Mcfarland Daniel T | $350,000 | -- | |
| Walters Randall D | -- | -- | |
| Walters Randall D | $320,000 | -- | |
| Pope Joseph M Karen T | $255,600 | -- |
Source: Public Records
Mortgage History
| Date | Status | Borrower | Loan Amount |
|---|---|---|---|
| Open | Mcfarland Daniel T | $280,000 | |
| Previous Owner | Walters Randall D | $304,000 | |
| Closed | Pope Joseph M Karen T | $0 |
Source: Public Records
Tax History Compared to Growth
Tax History
| Year | Tax Paid | Tax Assessment Tax Assessment Total Assessment is a certain percentage of the fair market value that is determined by local assessors to be the total taxable value of land and additions on the property. | Land | Improvement |
|---|---|---|---|---|
| 2024 | $6,253 | $200,000 | $37,600 | $162,400 |
| 2023 | $6,253 | $225,080 | $37,600 | $187,480 |
| 2022 | $4,682 | $125,360 | $29,800 | $95,560 |
| 2021 | $4,743 | $125,360 | $29,800 | $95,560 |
| 2020 | $4,771 | $134,440 | $29,800 | $104,640 |
| 2019 | $4,296 | $116,440 | $22,800 | $93,640 |
| 2018 | $4,302 | $116,440 | $22,800 | $93,640 |
| 2016 | $4,267 | $114,960 | $21,320 | $93,640 |
| 2015 | $3,836 | $101,560 | $19,600 | $81,960 |
| 2014 | $3,856 | $101,560 | $19,600 | $81,960 |
Source: Public Records
Map
Nearby Homes
- 2575 Hidden Wood Ln
- 2779 Lake Forest Trail
- 760 Woodrow Dr
- 465 Woodbrook Way
- 603 Old Peachtree Rd NE
- 420 Woodbrook Way Unit 7
- 2695 Collins Hill Rd
- 2701 Collins Hill Rd
- 283 Heron Lake Ct Unit 16
- 617 Rock Springs Rd
- 279 Collins View Ct
- 560 Tuscany Walk Ln NE
- 2542 Ashridge Ct
- 500 Meadowmeade Ln
- 627 Rock Springs Rd
- 230 Collins View Ct
- 681 Courageous Ct
- 511 Linley Trace Unit 15
- 531 Linley Trace
- 524 Misty Lake Ln
- 534 Misty Lake Ln Unit 10
- 516 Linley Trace Unit 15
- 526 Linley Trace
- 541 Linley Trace
- 544 Misty Lake Ln
- 506 Linley Trace NE
- 0 Misty Lake Ln Unit 8652088
- 0 Misty Lake Ln Unit 8424958
- 0 Misty Lake Ln Unit 8585551
- 0 Misty Lake Ln Unit 8968062
- 0 Misty Lake Ln Unit 8989428
- 0 Misty Lake Ln Unit 9001348
- 0 Misty Lake Ln Unit 7051660
- 0 Misty Lake Ln Unit 7091024
- 0 Misty Lake Ln Unit 7266510
- 0 Misty Lake Ln Unit 7614868
- 0 Misty Lake Ln Unit 8076532