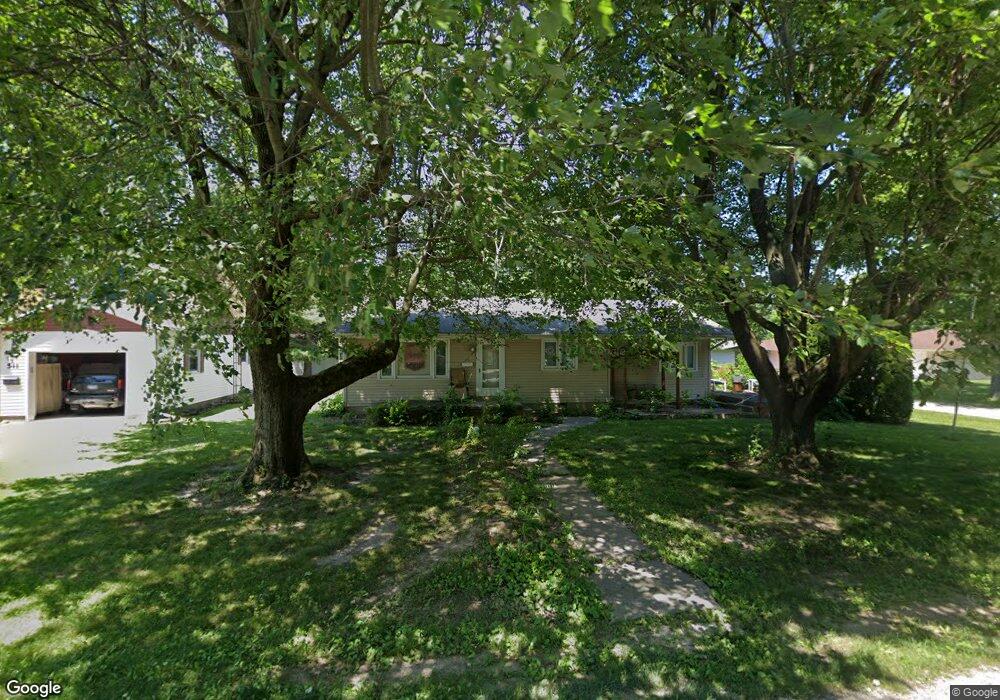
521 Logan St Nokomis, IL 62075
Estimated Value: $73,121 - $97,000
2
Beds
1
Bath
1,000
Sq Ft
$85/Sq Ft
Est. Value
About This Home
This home is located at 521 Logan St, Nokomis, IL 62075 and is currently estimated at $85,030, approximately $85 per square foot. 521 Logan St is a home located in Montgomery County with nearby schools including North Elementary School, Nokomis Junior/Senior High School, and St. Louis Catholic School.
Ownership History
Date
Name
Owned For
Owner Type
Purchase Details
Closed on
Jul 22, 2011
Sold by
Beaman Judy and Ruppert Harold
Bought by
Lamb Gary D
Current Estimated Value
Home Financials for this Owner
Home Financials are based on the most recent Mortgage that was taken out on this home.
Original Mortgage
$64,354
Outstanding Balance
$44,295
Interest Rate
4.52%
Mortgage Type
VA
Estimated Equity
$40,735
Purchase Details
Closed on
Jun 11, 2011
Sold by
Freitag Norma E
Bought by
Freitag Norma E
Home Financials for this Owner
Home Financials are based on the most recent Mortgage that was taken out on this home.
Original Mortgage
$64,354
Outstanding Balance
$44,295
Interest Rate
4.52%
Mortgage Type
VA
Estimated Equity
$40,735
Create a Home Valuation Report for This Property
The Home Valuation Report is an in-depth analysis detailing your home's value as well as a comparison with similar homes in the area
Home Values in the Area
Average Home Value in this Area
Purchase History
| Date | Buyer | Sale Price | Title Company |
|---|---|---|---|
| Lamb Gary D | $63,000 | None Available | |
| Freitag Norma E | -- | None Available |
Source: Public Records
Mortgage History
| Date | Status | Borrower | Loan Amount |
|---|---|---|---|
| Open | Lamb Gary D | $64,354 |
Source: Public Records
Tax History Compared to Growth
Tax History
| Year | Tax Paid | Tax Assessment Tax Assessment Total Assessment is a certain percentage of the fair market value that is determined by local assessors to be the total taxable value of land and additions on the property. | Land | Improvement |
|---|---|---|---|---|
| 2024 | $1,630 | $24,740 | $1,600 | $23,140 |
| 2023 | $1,511 | $23,200 | $1,500 | $21,700 |
| 2022 | $1,462 | $22,290 | $1,440 | $20,850 |
| 2021 | $1,529 | $23,290 | $1,510 | $21,780 |
| 2020 | $1,444 | $22,220 | $1,440 | $20,780 |
| 2019 | $1,544 | $23,460 | $1,520 | $21,940 |
| 2018 | $1,468 | $22,080 | $1,430 | $20,650 |
| 2017 | $1,389 | $20,750 | $1,340 | $19,410 |
| 2016 | $1,383 | $20,180 | $1,300 | $18,880 |
| 2015 | $1,349 | $19,550 | $1,260 | $18,290 |
| 2013 | $1,302 | $19,790 | $1,270 | $18,520 |
Source: Public Records
Map
Nearby Homes