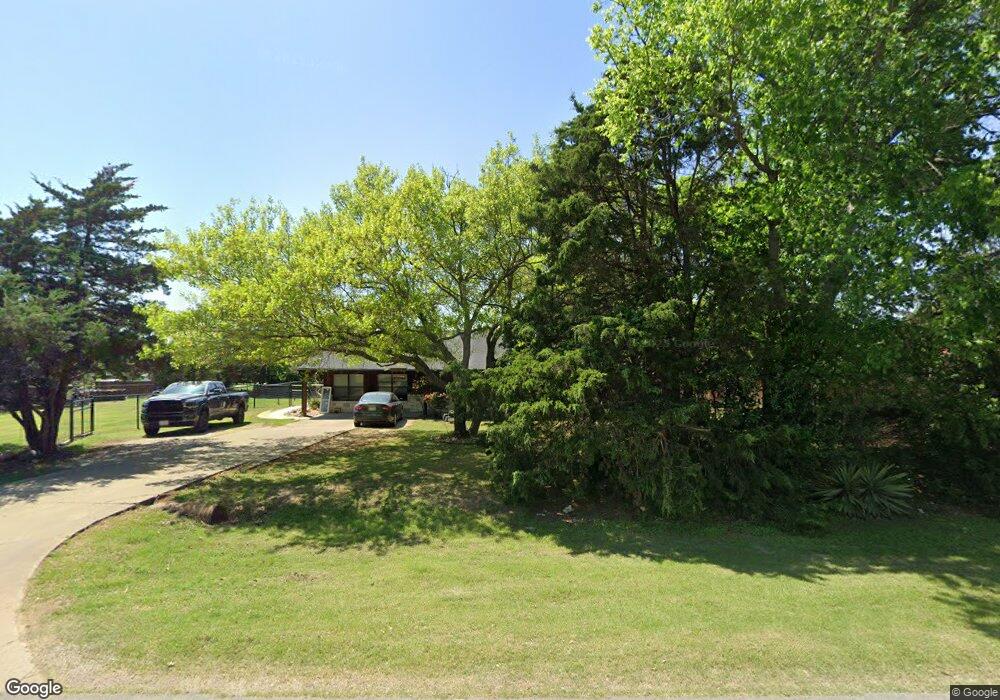
521 Lonquist Rd Midlothian, TX 76065
Estimated Value: $349,211 - $358,000
3
Beds
2
Baths
1,817
Sq Ft
$195/Sq Ft
Est. Value
About This Home
This home is located at 521 Lonquist Rd, Midlothian, TX 76065 and is currently estimated at $353,606, approximately $194 per square foot. 521 Lonquist Rd is a home located in Ellis County with nearby schools including T E Baxter Elementary School and Walnut Grove Middle School.
Ownership History
Date
Name
Owned For
Owner Type
Purchase Details
Closed on
Feb 27, 2012
Sold by
Bumard Tori Jones and Burnard Tori Camilla
Bought by
Mathews Jeffrey A and Mathews Laura L
Current Estimated Value
Purchase Details
Closed on
Oct 14, 2005
Sold by
Burnard Tori Jones and Rushing Tori Camilla
Bought by
Burnard Tori Jones
Home Financials for this Owner
Home Financials are based on the most recent Mortgage that was taken out on this home.
Original Mortgage
$72,600
Interest Rate
5.73%
Mortgage Type
New Conventional
Create a Home Valuation Report for This Property
The Home Valuation Report is an in-depth analysis detailing your home's value as well as a comparison with similar homes in the area
Home Values in the Area
Average Home Value in this Area
Purchase History
| Date | Buyer | Sale Price | Title Company |
|---|---|---|---|
| Mathews Jeffrey A | -- | None Available | |
| Burnard Tori Jones | -- | None Available |
Source: Public Records
Mortgage History
| Date | Status | Borrower | Loan Amount |
|---|---|---|---|
| Previous Owner | Burnard Tori Jones | $72,600 |
Source: Public Records
Tax History Compared to Growth
Tax History
| Year | Tax Paid | Tax Assessment Tax Assessment Total Assessment is a certain percentage of the fair market value that is determined by local assessors to be the total taxable value of land and additions on the property. | Land | Improvement |
|---|---|---|---|---|
| 2025 | $2,718 | $247,716 | -- | -- |
| 2024 | $2,718 | $225,196 | -- | -- |
| 2023 | $2,718 | $204,724 | $0 | $0 |
| 2022 | $4,170 | $186,113 | $0 | $0 |
| 2021 | $4,004 | $208,580 | $43,130 | $165,450 |
| 2020 | $3,869 | $189,310 | $42,000 | $147,310 |
| 2019 | $3,662 | $139,830 | $0 | $0 |
| 2018 | $3,523 | $133,390 | $30,000 | $103,390 |
| 2017 | $3,486 | $130,950 | $30,000 | $100,950 |
| 2016 | $3,191 | $119,880 | $30,000 | $89,880 |
| 2015 | $2,493 | $113,110 | $30,000 | $83,110 |
| 2014 | $2,493 | $109,490 | $0 | $0 |
Source: Public Records
Map
Nearby Homes
- 2 Saint Charles Place
- 111 Kirk Rd
- 112 Boardwalk St
- 800 Short Line Blvd
- 4210 Tea Olive Dr
- 4821 Azalea Way
- Lot 2 Tbd Ln
- Lot 3 Tbd Ln
- Lot 5 Tbd Ln
- 2814 Livestock Dr
- 1003 Boardwalk St
- 2818 Livestock Dr
- 2841 Livestock Dr
- 2817 Livestock Dr
- 2830 Livestock Dr
- 2825 Livestock Dr
- 2845 Livestock Dr
- 2834 Livestock Dr
- 2838 Livestock Dr
- 2846 Livestock Dr