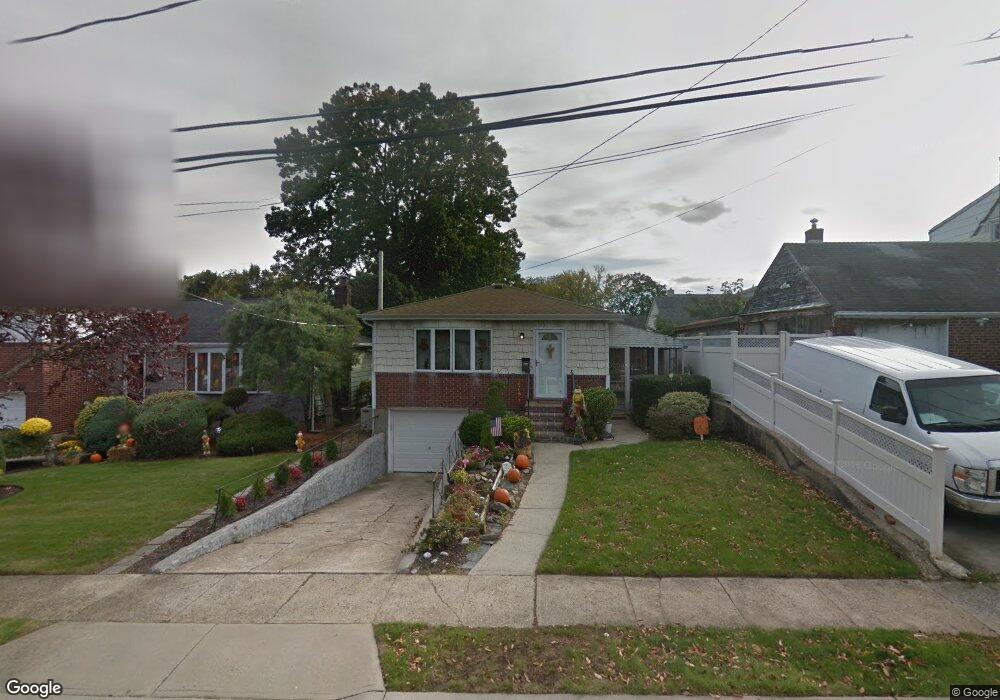
521 Maxwell St West Hempstead, NY 11552
Estimated Value: $707,450 - $715,000
3
Beds
2
Baths
1,054
Sq Ft
$675/Sq Ft
Est. Value
About This Home
This home is located at 521 Maxwell St, West Hempstead, NY 11552 and is currently estimated at $711,225, approximately $674 per square foot. 521 Maxwell St is a home located in Nassau County with nearby schools including Hebrew Academy of Nassau County (HANC).
Ownership History
Date
Name
Owned For
Owner Type
Purchase Details
Closed on
Dec 2, 2013
Sold by
Rossi Elizabeth G
Bought by
Cotignola Matthew A and Cotignola Theresa R
Current Estimated Value
Home Financials for this Owner
Home Financials are based on the most recent Mortgage that was taken out on this home.
Original Mortgage
$362,330
Outstanding Balance
$270,389
Interest Rate
4.17%
Estimated Equity
$440,836
Purchase Details
Closed on
May 1, 1995
Sold by
Rossi Guido
Bought by
Rossi Elizabeth
Create a Home Valuation Report for This Property
The Home Valuation Report is an in-depth analysis detailing your home's value as well as a comparison with similar homes in the area
Home Values in the Area
Average Home Value in this Area
Purchase History
| Date | Buyer | Sale Price | Title Company |
|---|---|---|---|
| Cotignola Matthew A | $381,400 | Triborough Land Services Inc | |
| Rossi Elizabeth | -- | -- |
Source: Public Records
Mortgage History
| Date | Status | Borrower | Loan Amount |
|---|---|---|---|
| Open | Cotignola Matthew A | $362,330 |
Source: Public Records
Tax History
| Year | Tax Paid | Tax Assessment Tax Assessment Total Assessment is a certain percentage of the fair market value that is determined by local assessors to be the total taxable value of land and additions on the property. | Land | Improvement |
|---|---|---|---|---|
| 2025 | $9,199 | $446 | $192 | $254 |
| 2024 | $4,619 | $517 | $222 | $295 |
Source: Public Records
Map
Nearby Homes
Your Personal Tour Guide
Ask me questions while you tour the home.