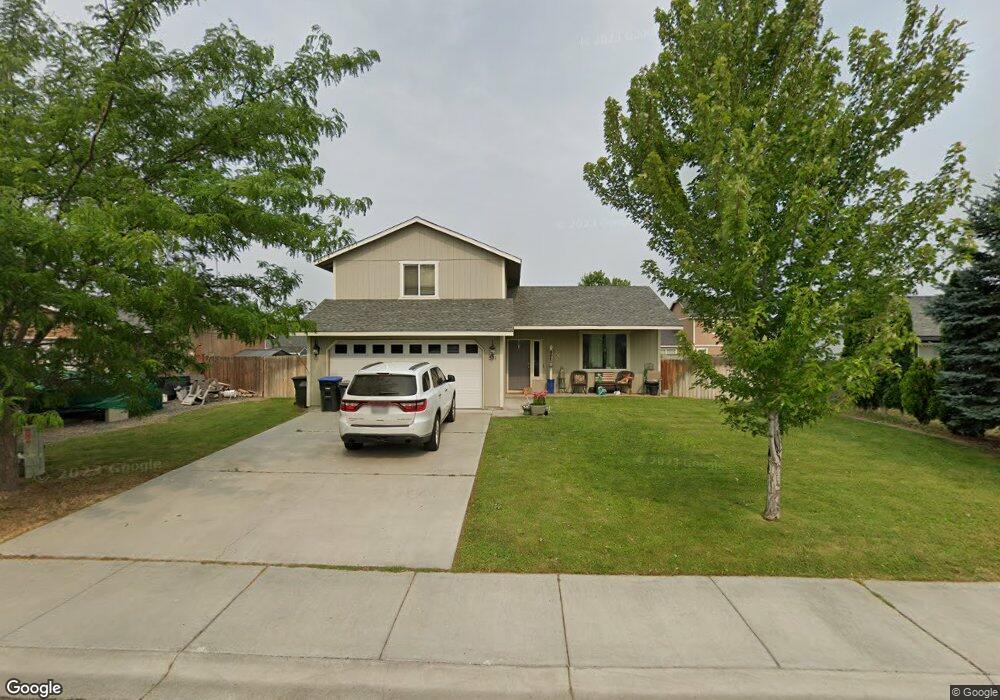
521 Monarch St Moses Lake, WA 98837
Estimated Value: $336,369 - $357,000
3
Beds
3
Baths
1,520
Sq Ft
$229/Sq Ft
Est. Value
About This Home
This home is located at 521 Monarch St, Moses Lake, WA 98837 and is currently estimated at $347,842, approximately $228 per square foot. 521 Monarch St is a home located in Grant County with nearby schools including Park Orchard Elementary School, Frontier Middle School, and Moses Lake High School.
Ownership History
Date
Name
Owned For
Owner Type
Purchase Details
Closed on
Sep 20, 2016
Sold by
Tunstall Pamela K and Tunstall Keith
Bought by
Hofstetter Danielle L
Current Estimated Value
Home Financials for this Owner
Home Financials are based on the most recent Mortgage that was taken out on this home.
Original Mortgage
$184,267
Outstanding Balance
$147,280
Interest Rate
3.45%
Mortgage Type
New Conventional
Estimated Equity
$200,562
Purchase Details
Closed on
Jul 14, 2006
Sold by
Wallace Greg A and Wallace Lori A
Bought by
Happer Pamela K
Home Financials for this Owner
Home Financials are based on the most recent Mortgage that was taken out on this home.
Original Mortgage
$140,068
Interest Rate
6.57%
Mortgage Type
Purchase Money Mortgage
Purchase Details
Closed on
Apr 18, 2006
Sold by
Olsen Homes Llc
Bought by
Wallace Greg A and Wallace Lori A
Create a Home Valuation Report for This Property
The Home Valuation Report is an in-depth analysis detailing your home's value as well as a comparison with similar homes in the area
Home Values in the Area
Average Home Value in this Area
Purchase History
| Date | Buyer | Sale Price | Title Company |
|---|---|---|---|
| Hofstetter Danielle L | $179,200 | Stewart Title | |
| Happer Pamela K | $144,400 | Security Title Guara | |
| Wallace Greg A | $118,000 | Security Title Guara |
Source: Public Records
Mortgage History
| Date | Status | Borrower | Loan Amount |
|---|---|---|---|
| Open | Hofstetter Danielle L | $184,267 | |
| Previous Owner | Happer Pamela K | $140,068 |
Source: Public Records
Tax History Compared to Growth
Tax History
| Year | Tax Paid | Tax Assessment Tax Assessment Total Assessment is a certain percentage of the fair market value that is determined by local assessors to be the total taxable value of land and additions on the property. | Land | Improvement |
|---|---|---|---|---|
| 2024 | $3,073 | $263,852 | $37,500 | $226,352 |
| 2023 | $2,751 | $233,695 | $28,000 | $205,695 |
| 2022 | $2,787 | $233,695 | $28,000 | $205,695 |
| 2021 | $2,133 | $233,695 | $28,000 | $205,695 |
| 2020 | $2,234 | $170,300 | $28,000 | $142,300 |
| 2019 | $2,292 | $156,070 | $28,000 | $128,070 |
| 2018 | $2,366 | $149,730 | $28,000 | $121,730 |
| 2017 | $2,188 | $139,965 | $25,000 | $114,965 |
| 2016 | $2,178 | $138,855 | $33,250 | $105,605 |
| 2013 | -- | $133,825 | $33,250 | $100,575 |
Source: Public Records
Map
Nearby Homes
- 521 Florida St
- 606 Florida St
- 603 N Crestview Dr
- 1514 W Bonneville St
- 1404 W Century St
- 634 N Crestview Dr
- 1310 W Virginia St
- 700 Widgeon St
- 418 N Crestview Dr
- 708 N Widgeon St
- 712 Widgeon St
- 1317 W Electra St
- 346 N Saratoga Way
- 1036 W Luta St
- 318 N Saratoga Way
- 721 Rockport St
- 1004 W Virginia St
- 8253 Scott Rd NE
- 211 Newfield Dr
- 207 W Newfield Place