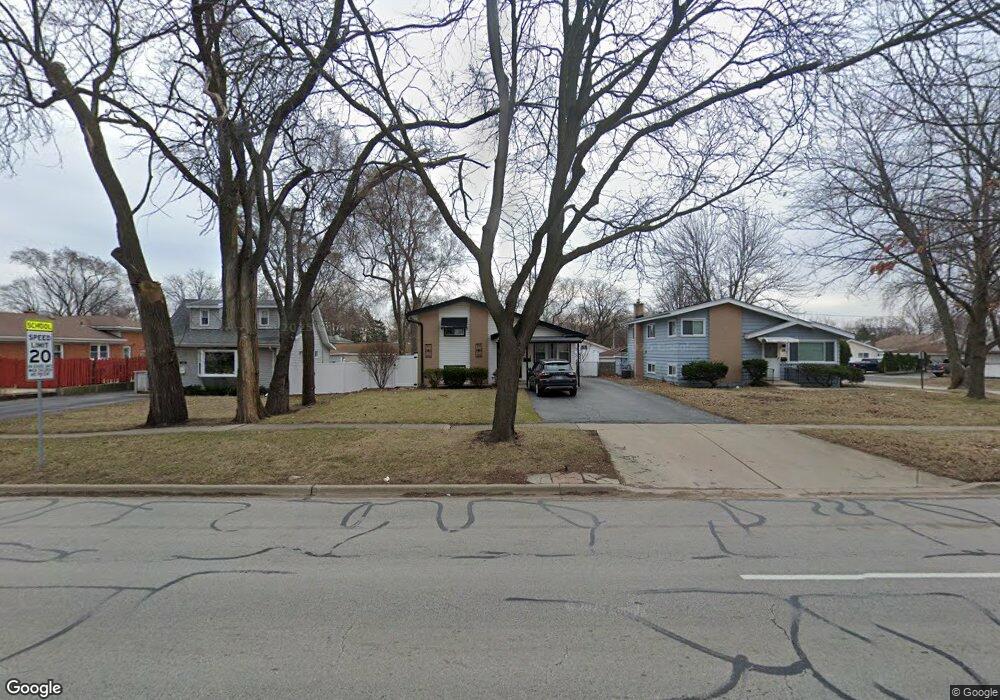
521 N Addison Rd Villa Park, IL 60181
Estimated Value: $324,000 - $360,000
3
Beds
2
Baths
1,062
Sq Ft
$323/Sq Ft
Est. Value
About This Home
This home is located at 521 N Addison Rd, Villa Park, IL 60181 and is currently estimated at $343,015, approximately $322 per square foot. 521 N Addison Rd is a home located in DuPage County with nearby schools including North Elementary School, Jefferson Middle School, and Willowbrook High School.
Ownership History
Date
Name
Owned For
Owner Type
Purchase Details
Closed on
Apr 8, 2010
Sold by
Federal Home Loan Mortgage Corporation
Bought by
Venable Andrew M and Venable Alicia A
Current Estimated Value
Home Financials for this Owner
Home Financials are based on the most recent Mortgage that was taken out on this home.
Original Mortgage
$161,397
Outstanding Balance
$107,549
Interest Rate
5.01%
Mortgage Type
VA
Estimated Equity
$235,466
Purchase Details
Closed on
Oct 6, 2009
Sold by
Gomez Ignacio
Bought by
Federal Home Loan Mortgage Corp
Purchase Details
Closed on
Jul 31, 2000
Sold by
Fanning Louis E and Fanning Jacqueline S
Bought by
Gomez Ignacio and Gomez Reynalda
Home Financials for this Owner
Home Financials are based on the most recent Mortgage that was taken out on this home.
Original Mortgage
$155,000
Interest Rate
8.16%
Mortgage Type
FHA
Create a Home Valuation Report for This Property
The Home Valuation Report is an in-depth analysis detailing your home's value as well as a comparison with similar homes in the area
Home Values in the Area
Average Home Value in this Area
Purchase History
| Date | Buyer | Sale Price | Title Company |
|---|---|---|---|
| Venable Andrew M | $158,000 | Atg | |
| Federal Home Loan Mortgage Corp | -- | None Available | |
| Gomez Ignacio | $163,000 | First American Title Ins |
Source: Public Records
Mortgage History
| Date | Status | Borrower | Loan Amount |
|---|---|---|---|
| Open | Venable Andrew M | $161,397 | |
| Previous Owner | Gomez Ignacio | $155,000 |
Source: Public Records
Tax History Compared to Growth
Tax History
| Year | Tax Paid | Tax Assessment Tax Assessment Total Assessment is a certain percentage of the fair market value that is determined by local assessors to be the total taxable value of land and additions on the property. | Land | Improvement |
|---|---|---|---|---|
| 2024 | $5,981 | $87,128 | $10,814 | $76,314 |
| 2023 | $5,682 | $80,570 | $10,000 | $70,570 |
| 2022 | $5,554 | $77,440 | $9,610 | $67,830 |
| 2021 | $5,325 | $75,510 | $9,370 | $66,140 |
| 2020 | $5,195 | $73,850 | $9,160 | $64,690 |
| 2019 | $4,844 | $70,210 | $8,710 | $61,500 |
| 2018 | $4,507 | $62,110 | $7,700 | $54,410 |
| 2017 | $4,392 | $59,190 | $7,340 | $51,850 |
| 2016 | $4,258 | $55,760 | $6,910 | $48,850 |
| 2015 | $4,186 | $51,950 | $6,440 | $45,510 |
| 2014 | $5,249 | $63,850 | $12,370 | $51,480 |
| 2013 | $5,004 | $64,750 | $12,540 | $52,210 |
Source: Public Records
Map
Nearby Homes
- 439 N Harvard Ave
- 417 W Terrace St
- 739 N 2nd Ave
- 700 W Pleasant St
- 434 N Lincoln Ave
- 2N152 Wisconsin Ave
- 490 N Chatham Ave
- 37 N Addison Rd
- 247 N Ardmore Ave
- 235 N Ardmore Ave
- 117 E Vermont St
- 58 E Division St
- 921 S Iowa Ave
- 913 S Iowa Ave
- 131 N Chase Ave
- 912 E Saint Charles Rd
- 933 W North Ave Unit A
- 935 E Saint Charles Rd
- 937 W North Ave Unit C
- 1136 E Kenilworth Ave
- 525 N Addison Rd
- 519 N Addison Rd
- 529 N Addison Rd
- 520 N Iowa Ave
- 518 N Iowa Ave
- 531 N Addison Rd
- 524 N Iowa Ave
- 526 N Iowa Ave
- 513 N Addison Rd
- 535 N Addison Rd
- 512 N Iowa Ave
- 526 N Addison Rd
- 518 N Addison Rd
- 530 N Iowa Ave
- 509 N Addison Rd
- 522 N Addison Rd
- 516 N Addison Rd
- 534 N Iowa Ave
- 508 N Iowa Ave
- 539 N Addison Rd