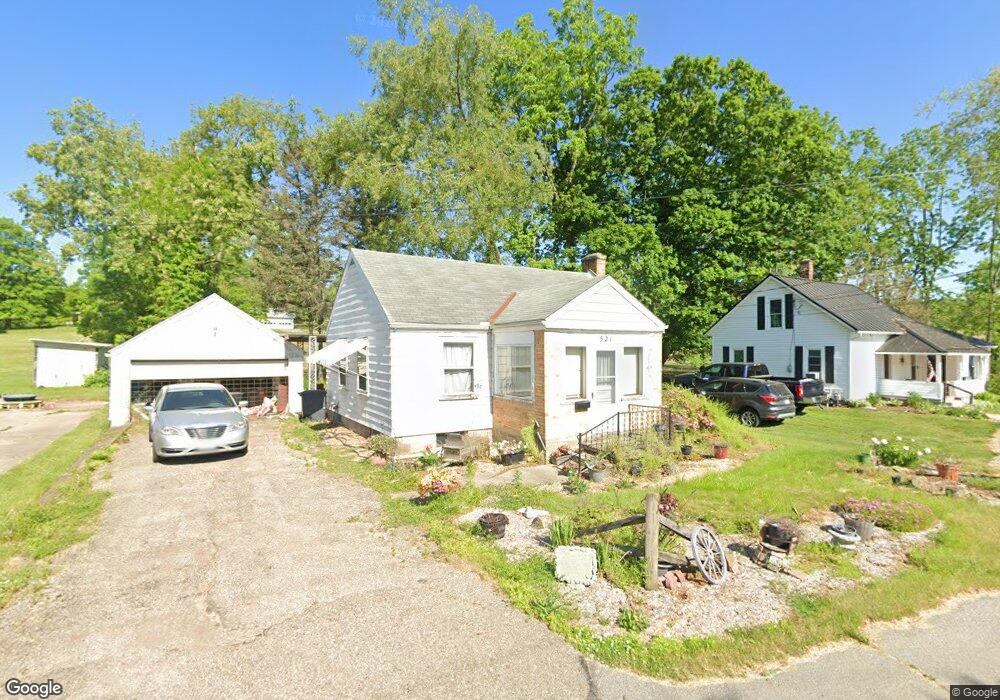
521 N Catherine St Mount Vernon, OH 43050
Estimated Value: $147,000 - $162,000
2
Beds
1
Bath
784
Sq Ft
$197/Sq Ft
Est. Value
About This Home
This home is located at 521 N Catherine St, Mount Vernon, OH 43050 and is currently estimated at $154,585, approximately $197 per square foot. 521 N Catherine St is a home located in Knox County with nearby schools including Mount Vernon High School, St. Vincent de Paul School, and Christian Star Academy.
Ownership History
Date
Name
Owned For
Owner Type
Purchase Details
Closed on
Jun 20, 2012
Sold by
Lamb Steve and Lamb Margaret J
Bought by
Lamb Steve
Current Estimated Value
Home Financials for this Owner
Home Financials are based on the most recent Mortgage that was taken out on this home.
Original Mortgage
$74,332
Outstanding Balance
$52,518
Interest Rate
4.25%
Mortgage Type
FHA
Estimated Equity
$102,067
Purchase Details
Closed on
Dec 22, 2004
Sold by
Barker Jean and Frye Eldon I
Bought by
Lamb Steve and Lamb Margaret
Purchase Details
Closed on
Sep 14, 2004
Sold by
Frye Eldon F
Bought by
Barker Jean and Frye Eldon I
Purchase Details
Closed on
Jun 13, 2001
Sold by
Frye Eldon F and Frye Hazel J
Bought by
Frye Eldon F
Purchase Details
Closed on
Oct 16, 2000
Sold by
Shaw Christopher A and Shaw Kell
Bought by
Frye Eldon F and Frye Hazel J
Purchase Details
Closed on
May 16, 1997
Sold by
Mcintire Kim K
Bought by
Shaw Christopher A and Shaw Kell
Purchase Details
Closed on
Nov 6, 1989
Sold by
Loyd Nellie A
Bought by
Mcintire Kim K
Create a Home Valuation Report for This Property
The Home Valuation Report is an in-depth analysis detailing your home's value as well as a comparison with similar homes in the area
Home Values in the Area
Average Home Value in this Area
Purchase History
| Date | Buyer | Sale Price | Title Company |
|---|---|---|---|
| Lamb Steve | -- | None Available | |
| Lamb Steve | $73,500 | -- | |
| Barker Jean | -- | -- | |
| Frye Eldon F | -- | -- | |
| Frye Eldon F | $59,500 | -- | |
| Shaw Christopher A | $26,000 | -- | |
| Mcintire Kim K | $32,500 | -- |
Source: Public Records
Mortgage History
| Date | Status | Borrower | Loan Amount |
|---|---|---|---|
| Open | Lamb Steve | $74,332 |
Source: Public Records
Tax History Compared to Growth
Tax History
| Year | Tax Paid | Tax Assessment Tax Assessment Total Assessment is a certain percentage of the fair market value that is determined by local assessors to be the total taxable value of land and additions on the property. | Land | Improvement |
|---|---|---|---|---|
| 2024 | $1,247 | $32,230 | $4,750 | $27,480 |
| 2023 | $1,247 | $32,230 | $4,750 | $27,480 |
| 2022 | $947 | $22,230 | $3,280 | $18,950 |
| 2021 | $947 | $22,230 | $3,280 | $18,950 |
| 2020 | $923 | $22,230 | $3,280 | $18,950 |
| 2019 | $904 | $20,300 | $3,540 | $16,760 |
| 2018 | $904 | $20,300 | $3,540 | $16,760 |
| 2017 | $888 | $20,300 | $3,540 | $16,760 |
| 2016 | $824 | $18,800 | $3,280 | $15,520 |
| 2015 | $828 | $18,800 | $3,280 | $15,520 |
| 2014 | $832 | $18,800 | $3,280 | $15,520 |
| 2013 | $848 | $18,180 | $2,660 | $15,520 |
Source: Public Records
Map
Nearby Homes
- 519 N Catherine St
- 601 N Catherine St
- 520 N Catherine St
- 513 N Catherine St
- 513 N Catherine St
- 518 N Catherine St
- 516 N Catherine St
- 512 N Catherine St
- 519 Braddock St
- 509 N Catherine St
- 515 Braddock St
- 515 Braddock St
- 510 N Catherine St
- 510 N Catherine St
- 511 Braddock St
- 0 Mckinley St Unit 224004414
- 0 Mckinley St
- 507 N Catherine St
- 508 N Catherine St
- 524 Braddock St