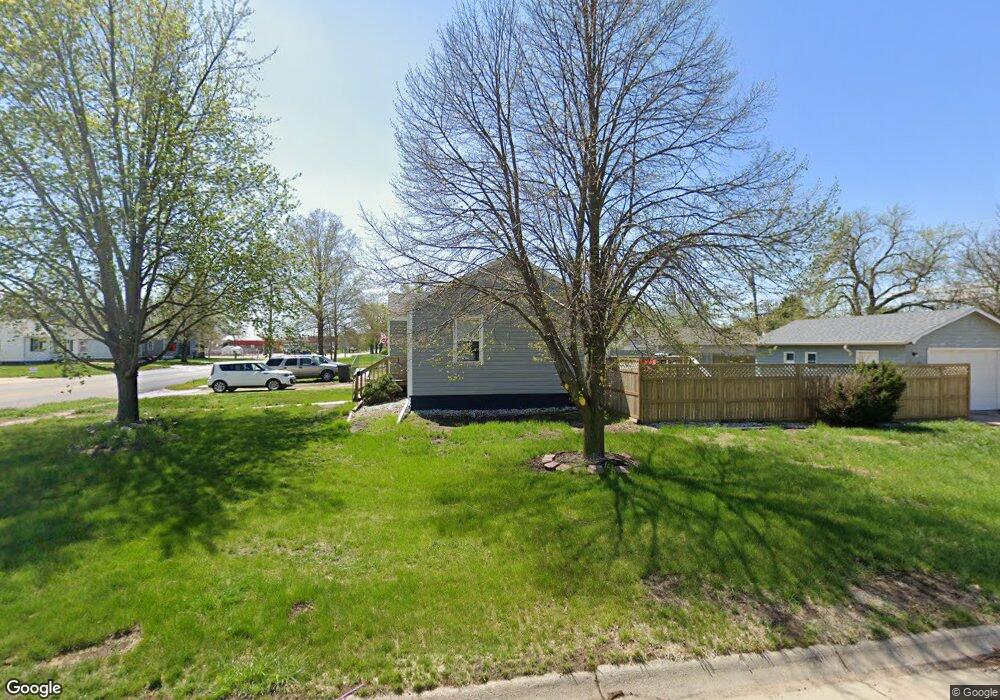
521 N Center St Clay Center, NE 68933
Estimated Value: $64,000 - $82,000
2
Beds
1
Bath
662
Sq Ft
$106/Sq Ft
Est. Value
About This Home
This home is located at 521 N Center St, Clay Center, NE 68933 and is currently estimated at $70,296, approximately $106 per square foot. 521 N Center St is a home located in Clay County with nearby schools including Clay Center Elementary School.
Ownership History
Date
Name
Owned For
Owner Type
Purchase Details
Closed on
Jul 5, 2022
Sold by
Veik Chad M
Bought by
Wavcin Llc
Current Estimated Value
Home Financials for this Owner
Home Financials are based on the most recent Mortgage that was taken out on this home.
Original Mortgage
$40,000
Outstanding Balance
$38,101
Interest Rate
5.23%
Mortgage Type
New Conventional
Estimated Equity
$32,195
Purchase Details
Closed on
Aug 13, 2020
Sold by
Kuta Francis and Kuta Ellen
Bought by
Veik Chad M and Veik Laura L
Purchase Details
Closed on
Jun 19, 2019
Sold by
Weidner Alan L and Weidner Gale
Bought by
Kuta Francis and Kuta Ellen
Purchase Details
Closed on
Sep 28, 2009
Sold by
Anderson Lynette
Bought by
Weidner Alan L
Create a Home Valuation Report for This Property
The Home Valuation Report is an in-depth analysis detailing your home's value as well as a comparison with similar homes in the area
Home Values in the Area
Average Home Value in this Area
Purchase History
| Date | Buyer | Sale Price | Title Company |
|---|---|---|---|
| Wavcin Llc | $55,000 | Adams Land Title | |
| Veik Chad M | $40,000 | Adams Land Title Company | |
| Kuta Francis | $17,000 | None Available | |
| Weidner Alan L | -- | Prairie Title Inc. |
Source: Public Records
Mortgage History
| Date | Status | Borrower | Loan Amount |
|---|---|---|---|
| Open | Wavcin Llc | $40,000 |
Source: Public Records
Tax History Compared to Growth
Tax History
| Year | Tax Paid | Tax Assessment Tax Assessment Total Assessment is a certain percentage of the fair market value that is determined by local assessors to be the total taxable value of land and additions on the property. | Land | Improvement |
|---|---|---|---|---|
| 2024 | $774 | $62,765 | $6,490 | $56,275 |
| 2023 | $1,135 | $70,580 | $5,770 | $64,810 |
| 2022 | $959 | $51,685 | $1,830 | $49,855 |
| 2021 | $927 | $48,865 | $1,830 | $47,035 |
| 2020 | $904 | $47,140 | $1,830 | $45,310 |
| 2019 | $786 | $43,785 | $1,830 | $41,955 |
| 2018 | $786 | $43,785 | $1,830 | $41,955 |
| 2017 | $691 | $40,810 | $1,830 | $38,980 |
| 2016 | $747 | $40,810 | $1,830 | $38,980 |
| 2015 | $793 | $40,810 | $1,830 | $38,980 |
| 2014 | $638 | $40,810 | $1,830 | $38,980 |
| 2013 | $638 | $24,685 | $1,835 | $22,850 |
Source: Public Records
Map
Nearby Homes
- 510 N Clay Ave
- 120 Northridge Dr
- 108 W Glenvil St
- 510 W Willow St
- 416 W South St
- 0 Pheasant View Lots
- 31020 Road L County Rd
- 208 N Kearney Ave
- 405 E Maple Ave
- 401 N Adams Ave
- 408 N Harvard Ave
- 1580
- 1580 Road 320
- 401 Chestnut St
- 608 1st St
- 811 Grandview St
- 506 W Cedar St
- 803 6th St
- 507 S Maltby Ave
- 502 S Maltby Ave
- 519 N Center St
- 513 N Center St
- 507 N Center St
- 518 N Clay Ave
- 518 N Center St
- 518 N Center St
- 503 N Center St
- 512 N Center St
- 610 N Clay Ave
- 508 N Center St
- 604 N Center St
- 504 N Center St
- 502 N Clay Ave
- 312 E Thurber St
- 309 E Thurber St
- 500 N Center St
- 521 N Clay Ave
- 313 E Thurber St
- 318 E Thurber St
- 616 N Clay Ave