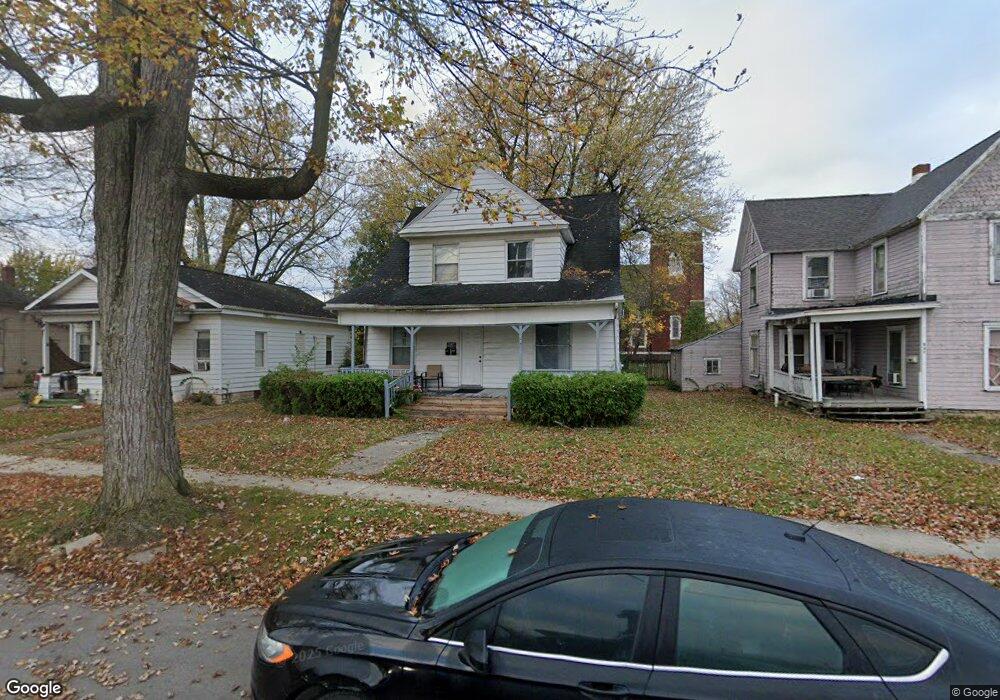
521 N Charles St Lima, OH 45805
Central Lima NeighborhoodEstimated Value: $88,000 - $138,000
4
Beds
2
Baths
1,754
Sq Ft
$60/Sq Ft
Est. Value
About This Home
This home is located at 521 N Charles St, Lima, OH 45805 and is currently estimated at $104,906, approximately $59 per square foot. 521 N Charles St is a home located in Allen County with nearby schools including Heritage Elementary School, Lima North Middle School, and Lima West Middle School.
Ownership History
Date
Name
Owned For
Owner Type
Purchase Details
Closed on
May 24, 2011
Sold by
First Federal Bank Of The Midwest
Bought by
Johnson Gregory D
Current Estimated Value
Purchase Details
Closed on
Apr 14, 2010
Sold by
Mcclintock Marsha S and Schnipke Marsha S
Bought by
First Federal Bank Of The Midwest
Purchase Details
Closed on
Jul 2, 1997
Sold by
Shrf Jeffrey Orphal Pr
Bought by
Schnipke Marsha
Home Financials for this Owner
Home Financials are based on the most recent Mortgage that was taken out on this home.
Original Mortgage
$32,399
Interest Rate
8.75%
Mortgage Type
New Conventional
Purchase Details
Closed on
Jul 14, 1993
Sold by
Denney Jeffrey Alan
Bought by
Orphal Jeffrey A and Orphal Judith M
Purchase Details
Closed on
Feb 7, 1991
Bought by
Denney Jeffrey Alan
Create a Home Valuation Report for This Property
The Home Valuation Report is an in-depth analysis detailing your home's value as well as a comparison with similar homes in the area
Home Values in the Area
Average Home Value in this Area
Purchase History
| Date | Buyer | Sale Price | Title Company |
|---|---|---|---|
| Johnson Gregory D | $5,500 | Attorney | |
| First Federal Bank Of The Midwest | -- | Attorney | |
| Schnipke Marsha | $17,000 | -- | |
| Orphal Jeffrey A | $30,000 | -- | |
| Denney Jeffrey Alan | $25,000 | -- |
Source: Public Records
Mortgage History
| Date | Status | Borrower | Loan Amount |
|---|---|---|---|
| Previous Owner | Schnipke Marsha | $32,399 |
Source: Public Records
Tax History Compared to Growth
Tax History
| Year | Tax Paid | Tax Assessment Tax Assessment Total Assessment is a certain percentage of the fair market value that is determined by local assessors to be the total taxable value of land and additions on the property. | Land | Improvement |
|---|---|---|---|---|
| 2024 | $819 | $21,490 | $2,450 | $19,040 |
| 2023 | $872 | $18,840 | $2,140 | $16,700 |
| 2022 | $824 | $18,840 | $2,140 | $16,700 |
| 2021 | $873 | $18,840 | $2,140 | $16,700 |
| 2020 | $874 | $16,700 | $2,070 | $14,630 |
| 2019 | $874 | $16,700 | $2,070 | $14,630 |
| 2018 | $896 | $16,700 | $2,070 | $14,630 |
| 2017 | $877 | $16,700 | $2,070 | $14,630 |
| 2016 | $889 | $16,700 | $2,070 | $14,630 |
| 2015 | $976 | $16,700 | $2,070 | $14,630 |
| 2014 | $976 | $18,170 | $2,210 | $15,960 |
| 2013 | $950 | $18,170 | $2,210 | $15,960 |
Source: Public Records
Map
Nearby Homes
- 618 Woodward Ave
- 1120 Richie Ave
- 1023 Leland Ave
- 1036 W High St
- 1206 Rice Ave
- 631 Hazel Ave
- 648 Hazel Ave
- 638 Hazel Ave
- 745 Brice Ave
- 676 Cortlandt Ave
- 627 Brice Ave
- 612 N Metcalf St
- 708 N Metcalf St
- 576 Cortlandt Ave
- 434 N Washington St
- 1517 Allentown Rd
- 1116 Belvidere Ave
- 233 S Kenilworth Ave
- 325 N McDonel St
- 621 Fairfield Dr
- 531 N Charles St
- 1011 Richie Ave
- 513 N Charles St
- 981 Richie Ave
- 507 N Charles St
- 601 N Charles St
- 1101-1017 N Jameson Ave
- 510 N Charles St
- 1014 Brice Ave
- 977 Richie Ave
- 503 N Charles St
- 605 N Charles St
- 1010 Brice Ave
- 1020 Brice Ave
- 1014 Richie Ave
- 1025 Richie Ave
- 992 Brice Ave
- 605-611 Charles N
- 1012 Brice Ave