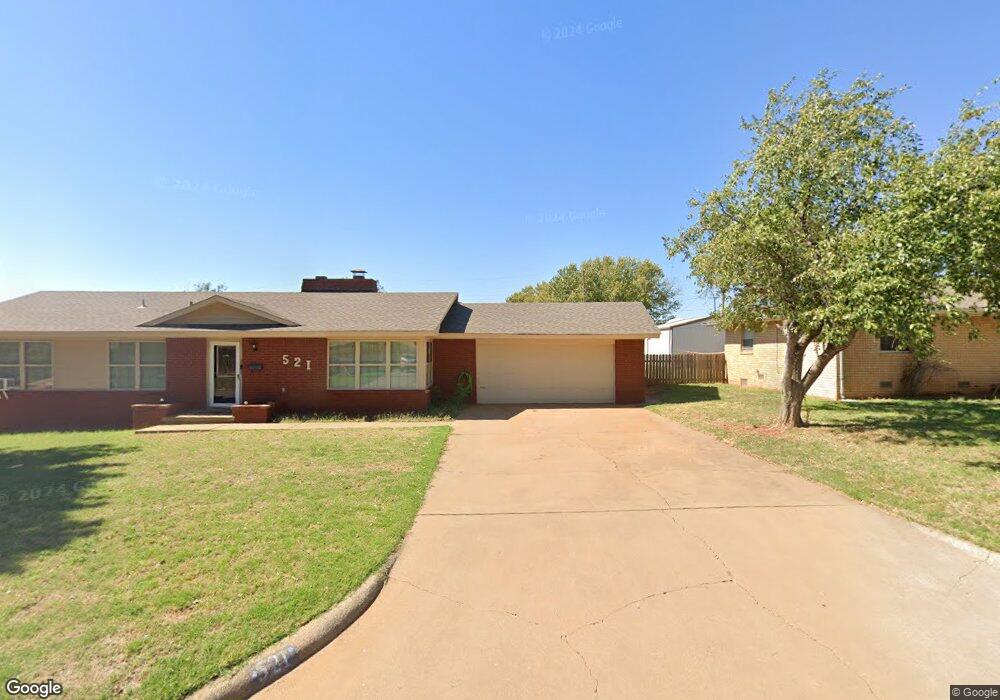
521 N Daniel St Weatherford, OK 73096
Estimated Value: $157,000 - $182,854
2
Beds
2
Baths
1,841
Sq Ft
$91/Sq Ft
Est. Value
About This Home
This home is located at 521 N Daniel St, Weatherford, OK 73096 and is currently estimated at $167,464, approximately $90 per square foot. 521 N Daniel St is a home located in Custer County with nearby schools including Burcham Elementary School, Weatherford West Elementary School, and Lt. General Thomas P. Stafford Elementary School.
Ownership History
Date
Name
Owned For
Owner Type
Purchase Details
Closed on
May 12, 2025
Sold by
Schmitz Christopher L and Schmitz Nikki D
Bought by
Adams Ron and Adams Dustin
Current Estimated Value
Purchase Details
Closed on
Mar 13, 2023
Sold by
Skinner Ronnie C and Skinner Reta K
Bought by
Schmitz Christopher Lee
Home Financials for this Owner
Home Financials are based on the most recent Mortgage that was taken out on this home.
Original Mortgage
$127,573
Interest Rate
5.29%
Mortgage Type
Construction
Purchase Details
Closed on
Oct 7, 2015
Sold by
King Phillip M and King Stavey L
Bought by
Skinner Ronnie C
Home Financials for this Owner
Home Financials are based on the most recent Mortgage that was taken out on this home.
Original Mortgage
$406,060
Interest Rate
4.5%
Mortgage Type
New Conventional
Purchase Details
Closed on
Mar 23, 2001
Sold by
Marie King Life Estate
Bought by
Phillip M King
Create a Home Valuation Report for This Property
The Home Valuation Report is an in-depth analysis detailing your home's value as well as a comparison with similar homes in the area
Home Values in the Area
Average Home Value in this Area
Purchase History
| Date | Buyer | Sale Price | Title Company |
|---|---|---|---|
| Adams Ron | $125,000 | Attorney Only | |
| Schmitz Christopher Lee | $125,000 | Old Republic Title Co Ok | |
| Skinner Ronnie C | $104,000 | -- | |
| Phillip M King | -- | -- |
Source: Public Records
Mortgage History
| Date | Status | Borrower | Loan Amount |
|---|---|---|---|
| Previous Owner | Schmitz Christopher Lee | $127,573 | |
| Previous Owner | Skinner Ronnie C | $406,060 |
Source: Public Records
Tax History Compared to Growth
Tax History
| Year | Tax Paid | Tax Assessment Tax Assessment Total Assessment is a certain percentage of the fair market value that is determined by local assessors to be the total taxable value of land and additions on the property. | Land | Improvement |
|---|---|---|---|---|
| 2025 | $1,356 | $14,438 | $839 | $13,599 |
| 2024 | $1,356 | $13,750 | $799 | $12,951 |
| 2023 | $1,356 | $14,600 | $896 | $13,704 |
| 2022 | $1,338 | $13,906 | $850 | $13,056 |
| 2021 | $1,284 | $13,243 | $805 | $12,438 |
| 2020 | $1,271 | $12,613 | $763 | $11,850 |
| 2019 | $1,223 | $12,012 | $722 | $11,290 |
| 2018 | $1,059 | $11,441 | $1,128 | $10,313 |
| 2017 | $1,078 | $11,441 | $1,128 | $10,313 |
| 2016 | $1,088 | $11,441 | $1,128 | $10,313 |
| 2015 | $930 | $9,635 | $730 | $8,905 |
| 2014 | $884 | $9,176 | $675 | $8,501 |
Source: Public Records
Map
Nearby Homes