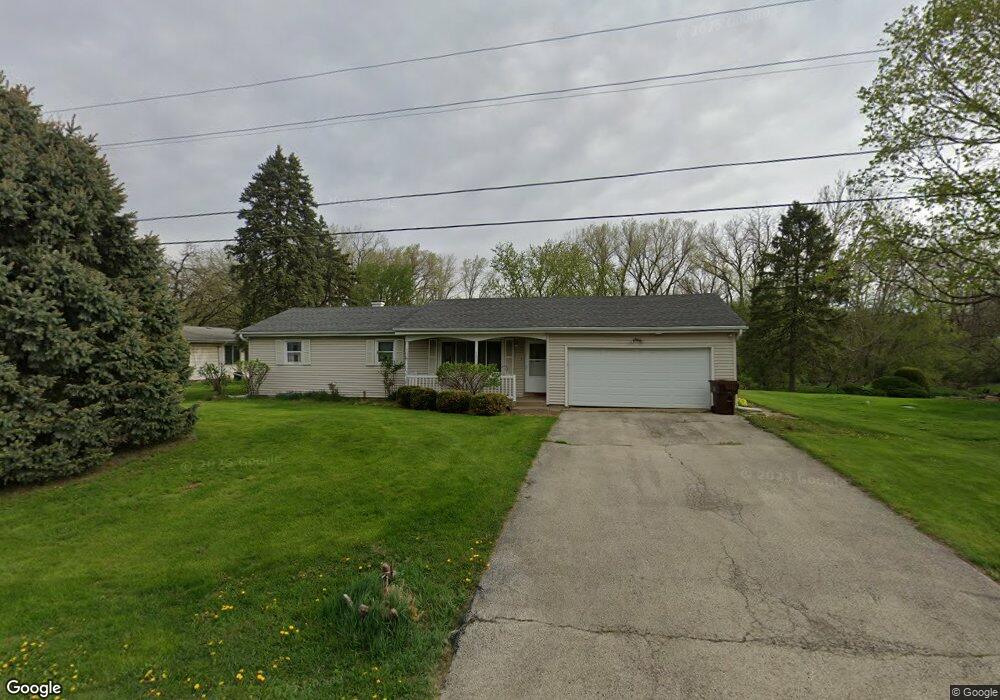
521 Old Hickory Rd New Lenox, IL 60451
Estimated Value: $254,891 - $335,000
3
Beds
2
Baths
--
Sq Ft
0.5
Acres
About This Home
This home is located at 521 Old Hickory Rd, New Lenox, IL 60451 and is currently estimated at $308,973. 521 Old Hickory Rd is a home located in Will County with nearby schools including Haines Elementary School, Oster-Oakview School, and Lincoln Way West.
Ownership History
Date
Name
Owned For
Owner Type
Purchase Details
Closed on
Apr 29, 2004
Sold by
Kanta Kevin G and Kanta Patricia S
Bought by
Perry Celeste
Current Estimated Value
Home Financials for this Owner
Home Financials are based on the most recent Mortgage that was taken out on this home.
Original Mortgage
$132,700
Outstanding Balance
$62,218
Interest Rate
5.5%
Mortgage Type
Purchase Money Mortgage
Estimated Equity
$246,756
Purchase Details
Closed on
Nov 14, 2001
Sold by
Haynes Lattina Pamela R and Haynes Newman A
Bought by
Kanta Kevin G
Home Financials for this Owner
Home Financials are based on the most recent Mortgage that was taken out on this home.
Original Mortgage
$60,000
Interest Rate
6.6%
Purchase Details
Closed on
Sep 14, 2000
Sold by
Haynes Lattina Pamela
Bought by
Haynes Newman A
Purchase Details
Closed on
Aug 15, 2000
Sold by
Haynes Newman A
Bought by
Haynes Lattina Pamela R
Purchase Details
Closed on
Jun 3, 1996
Sold by
Haynes Newman A
Bought by
Haynes Newman A and Kanta Kevin G
Create a Home Valuation Report for This Property
The Home Valuation Report is an in-depth analysis detailing your home's value as well as a comparison with similar homes in the area
Home Values in the Area
Average Home Value in this Area
Purchase History
| Date | Buyer | Sale Price | Title Company |
|---|---|---|---|
| Perry Celeste | $185,000 | Chicago Title Insurance Co | |
| Kanta Kevin G | $50,000 | Ticor Title | |
| Haynes Newman A | -- | -- | |
| Haynes Lattina Pamela R | -- | -- | |
| Haynes Newman A | -- | -- |
Source: Public Records
Mortgage History
| Date | Status | Borrower | Loan Amount |
|---|---|---|---|
| Open | Perry Celeste | $132,700 | |
| Previous Owner | Kanta Kevin G | $60,000 |
Source: Public Records
Tax History Compared to Growth
Tax History
| Year | Tax Paid | Tax Assessment Tax Assessment Total Assessment is a certain percentage of the fair market value that is determined by local assessors to be the total taxable value of land and additions on the property. | Land | Improvement |
|---|---|---|---|---|
| 2024 | $5,543 | $80,838 | $23,194 | $57,644 |
| 2023 | $5,543 | $73,690 | $21,143 | $52,547 |
| 2022 | $4,995 | $67,886 | $19,478 | $48,408 |
| 2021 | $4,719 | $63,844 | $18,318 | $45,526 |
| 2020 | $4,570 | $61,566 | $17,664 | $43,902 |
| 2019 | $4,358 | $59,657 | $17,116 | $42,541 |
| 2018 | $4,414 | $57,601 | $16,526 | $41,075 |
| 2017 | $4,183 | $55,945 | $16,051 | $39,894 |
| 2016 | $4,054 | $54,447 | $15,621 | $38,826 |
| 2015 | $3,915 | $52,733 | $15,129 | $37,604 |
| 2014 | $3,915 | $52,082 | $14,942 | $37,140 |
| 2013 | $3,915 | $52,784 | $15,143 | $37,641 |
Source: Public Records
Map
Nearby Homes
- 1500 Ramp
- Vacant W Maple St
- 331 Old Hickory Rd
- 338 Willow St
- 218 Manor Dr Unit A
- 1701 Grand Prairie Dr
- 1301 Silver Cross Blvd
- 416 Manor Ct Unit B
- 574 Prairie Crossing Dr
- 125 Kimber Dr
- 154 Barbara Ln
- 133 Barbara Ln
- 217 Aspen Dr
- 203 Fir St
- 315 S Pine St
- 0 Silver Cross Blvd
- 1344 N Cedar Rd
- 2834 Sharon Dr
- 709 Young Dr
- 450 Kingston Dr
- 527 Old Hickory Rd
- 509 Old Hickory Rd
- 526 Old Hickory Rd
- 522 Old Hickory Rd
- 530 Old Hickory Rd
- 520 Old Hickory Rd
- 514 Old Hickory Rd
- 538 Old Hickory Rd
- 505 Old Hickory Rd
- 510 Old Hickory Rd
- 540 Old Hickory Rd
- 506 Old Hickory Rd
- 535 Old Hickory Rd
- 501 Old Hickory Rd
- 502 Old Hickory Rd
- 542 Old Hickory Rd
- 539 Old Hickory Rd
- 462 Old Hickory Rd
- 541 Old Hickory Rd