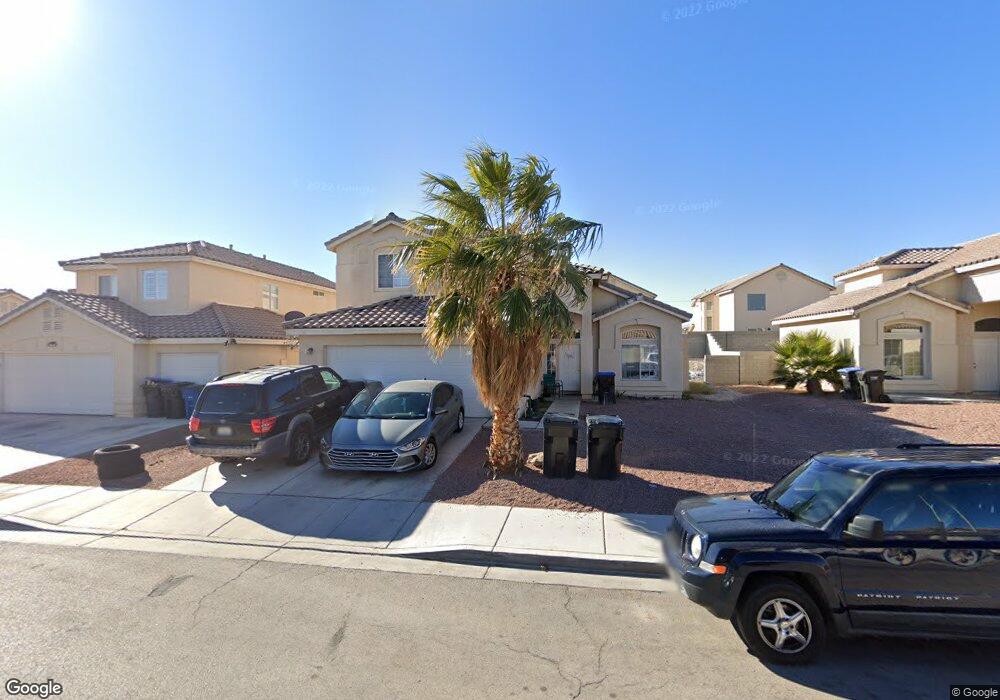
521 Princess Ave Unit 1D North Las Vegas, NV 89030
Downtown North Las Vegas NeighborhoodEstimated Value: $407,000 - $453,000
4
Beds
3
Baths
2,188
Sq Ft
$194/Sq Ft
Est. Value
About This Home
This home is located at 521 Princess Ave Unit 1D, North Las Vegas, NV 89030 and is currently estimated at $425,433, approximately $194 per square foot. 521 Princess Ave Unit 1D is a home located in Clark County with nearby schools including H.P. Fitzgerald Elementary School, West Prepatory Academy At Charlles I West Hall Sec, and Canyon Springs High School And The Leadership And.
Ownership History
Date
Name
Owned For
Owner Type
Purchase Details
Closed on
Oct 6, 2011
Sold by
The Bank Of New York Mellon
Bought by
Moon Hill Properties Llc
Current Estimated Value
Purchase Details
Closed on
Jan 18, 2011
Sold by
Candido Heriberto and Lara Aleyda E
Bought by
The Bank Of New York Mellon and The Bank Of New York
Purchase Details
Closed on
Aug 4, 2005
Sold by
Lear Amra
Bought by
Candido Heriberto and Lara Aleyda E
Home Financials for this Owner
Home Financials are based on the most recent Mortgage that was taken out on this home.
Original Mortgage
$256,500
Interest Rate
6.8%
Mortgage Type
Unknown
Purchase Details
Closed on
Mar 7, 2005
Sold by
Avenue Carey
Bought by
Lear Amra
Home Financials for this Owner
Home Financials are based on the most recent Mortgage that was taken out on this home.
Original Mortgage
$177,168
Interest Rate
5.65%
Mortgage Type
FHA
Create a Home Valuation Report for This Property
The Home Valuation Report is an in-depth analysis detailing your home's value as well as a comparison with similar homes in the area
Home Values in the Area
Average Home Value in this Area
Purchase History
| Date | Buyer | Sale Price | Title Company |
|---|---|---|---|
| Moon Hill Properties Llc | $74,500 | Chicago Title Las Vegas | |
| The Bank Of New York Mellon | $85,500 | Accommodation | |
| Candido Heriberto | $285,000 | Nevada Title Company | |
| Lear Amra | $179,990 | Lawyers Title Of Nevada |
Source: Public Records
Mortgage History
| Date | Status | Borrower | Loan Amount |
|---|---|---|---|
| Previous Owner | Candido Heriberto | $256,500 | |
| Previous Owner | Lear Amra | $177,168 |
Source: Public Records
Tax History Compared to Growth
Tax History
| Year | Tax Paid | Tax Assessment Tax Assessment Total Assessment is a certain percentage of the fair market value that is determined by local assessors to be the total taxable value of land and additions on the property. | Land | Improvement |
|---|---|---|---|---|
| 2025 | $1,610 | $117,734 | $28,000 | $89,734 |
| 2024 | $1,491 | $117,734 | $28,000 | $89,734 |
| 2023 | $1,491 | $111,950 | $27,300 | $84,650 |
| 2022 | $1,381 | $100,279 | $23,100 | $77,179 |
| 2021 | $1,279 | $96,258 | $23,100 | $73,158 |
| 2020 | $1,184 | $80,755 | $17,850 | $62,905 |
| 2019 | $1,110 | $68,109 | $14,000 | $54,109 |
| 2018 | $1,059 | $72,134 | $12,250 | $59,884 |
| 2017 | $2,314 | $68,982 | $9,100 | $59,882 |
| 2016 | $993 | $51,157 | $5,950 | $45,207 |
| 2015 | $992 | $45,374 | $4,900 | $40,474 |
| 2014 | $964 | $34,039 | $3,500 | $30,539 |
Source: Public Records
Map
Nearby Homes
- 433 Duchess Ave
- 508 Sand Sage Ave
- 704 Kings Ave
- 00 Rossmoyne Ave
- 0 Rossmoyne Ave
- 0 Miller Steet
- 0 Miller Streeet
- 0 Miller Ave
- 400 Rossmoyne Ave
- 725 Miller Ave
- 309 Rossmoyne Ave
- 421 Miller Ave
- 0 Windsor St Unit 2693785
- 2419 Country Orchard St
- 00 Duquesne Ave
- 4 Duquesne Ave
- 301 Lance Ave
- 629 Hause Ave
- 700 van Ert Ave
- 0 Reverend Wilson Ave Unit 2710235
- 605 Princess Ave
- 517 Princess Ave
- 616 Count Ave
- 616 Count Ave Unit None
- 612 Count Ave
- 620 Count Ave
- 620 Count Ave Unit 620
- 620 Count Ave Unit n/a
- 609 Princess Ave
- 513 Princess Ave Unit 1D
- 516 Count Ave
- 624 Count Ave
- 624 Count Ave Unit none
- 520 Princess Ave Unit 1D
- 516 Princess Ave
- 524 Princess Ave
- 628 Count Ave
- 628 Count Ave
- 628 Count Ave
- 628 Count Ave