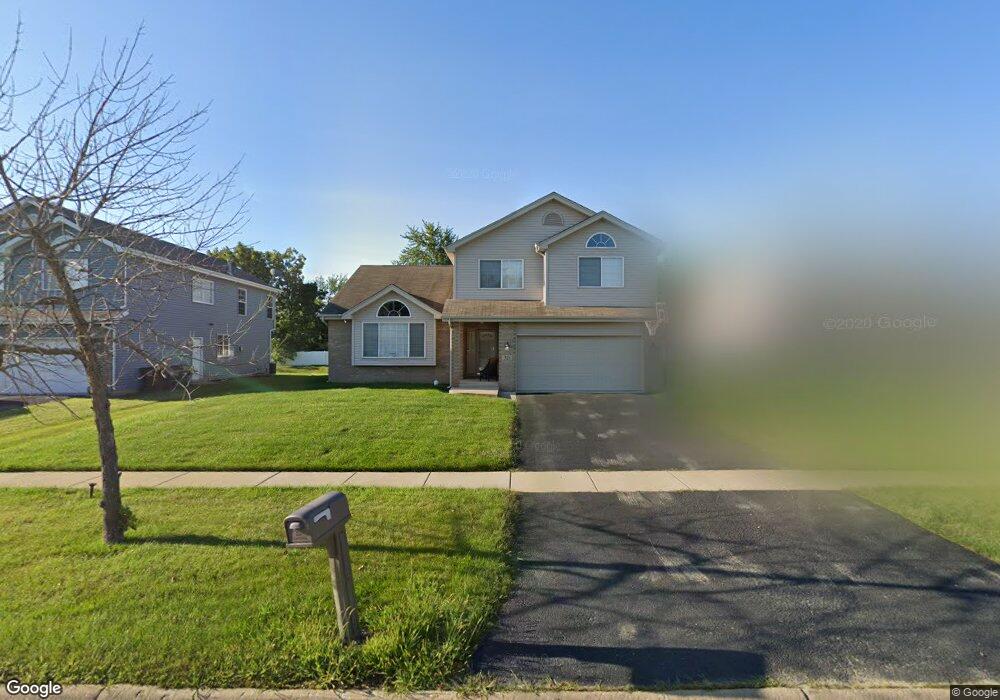
521 Regent Rd University Park, IL 60484
Estimated Value: $282,000 - $353,000
4
Beds
3
Baths
2,465
Sq Ft
$129/Sq Ft
Est. Value
About This Home
This home is located at 521 Regent Rd, University Park, IL 60484 and is currently estimated at $317,973, approximately $128 per square foot. 521 Regent Rd is a home located in Will County with nearby schools including Balmoral Elementary School, Crete-Monee Middle School, and Crete-Monee High School.
Ownership History
Date
Name
Owned For
Owner Type
Purchase Details
Closed on
Jun 5, 2013
Sold by
Jackson David
Bought by
Jackson Shawntell M
Current Estimated Value
Purchase Details
Closed on
Nov 8, 2007
Sold by
Chicago Title Landtrust Co
Bought by
Jackson David and Jackson Shawntell M
Home Financials for this Owner
Home Financials are based on the most recent Mortgage that was taken out on this home.
Original Mortgage
$258,216
Outstanding Balance
$162,954
Interest Rate
6.33%
Mortgage Type
FHA
Estimated Equity
$155,019
Create a Home Valuation Report for This Property
The Home Valuation Report is an in-depth analysis detailing your home's value as well as a comparison with similar homes in the area
Home Values in the Area
Average Home Value in this Area
Purchase History
| Date | Buyer | Sale Price | Title Company |
|---|---|---|---|
| Jackson Shawntell M | -- | None Available | |
| Jackson David | $262,000 | Chicago Title Insurance Co |
Source: Public Records
Mortgage History
| Date | Status | Borrower | Loan Amount |
|---|---|---|---|
| Open | Jackson David | $258,216 |
Source: Public Records
Tax History Compared to Growth
Tax History
| Year | Tax Paid | Tax Assessment Tax Assessment Total Assessment is a certain percentage of the fair market value that is determined by local assessors to be the total taxable value of land and additions on the property. | Land | Improvement |
|---|---|---|---|---|
| 2024 | $10,242 | $89,604 | $14,480 | $75,124 |
| 2023 | $10,242 | $77,245 | $12,483 | $64,762 |
| 2022 | $8,731 | $67,950 | $10,981 | $56,969 |
| 2021 | $8,243 | $61,890 | $10,086 | $51,804 |
| 2020 | $7,959 | $58,661 | $9,759 | $48,902 |
| 2019 | $8,048 | $55,630 | $9,255 | $46,375 |
| 2018 | $8,165 | $55,344 | $9,069 | $46,275 |
| 2017 | $8,467 | $56,052 | $8,823 | $47,229 |
| 2016 | $8,373 | $55,414 | $8,500 | $46,914 |
| 2015 | $7,473 | $52,680 | $8,086 | $44,594 |
| 2014 | $7,473 | $51,952 | $7,974 | $43,978 |
| 2013 | $7,473 | $54,400 | $8,350 | $46,050 |
Source: Public Records
Map
Nearby Homes
- 524 Regent Rd
- 903 Blackhawk Dr
- 815 Blackhawk Dr
- 1001 Blackhawk Dr
- 807 Blackhawk Dr
- 735 Union Dr
- 607 Sullivan Ln
- 608 Sullivan Ln
- 1043 Ashridge Ln
- 505 Barbara Ct
- 740 Mission St
- 453 Fairway Ct
- 662 Sullivan Ln
- 754 Mission Dr
- 1031 Blackhawk Dr
- 1109 Abbot Ln
- 1061 Amherst Ln
- 24625 S Western Ave
- 469 Fairway Ln
- 708 Blackhawk Dr