Estimated Value: $366,000 - $620,000
Studio
--
Bath
2,394
Sq Ft
$195/Sq Ft
Est. Value
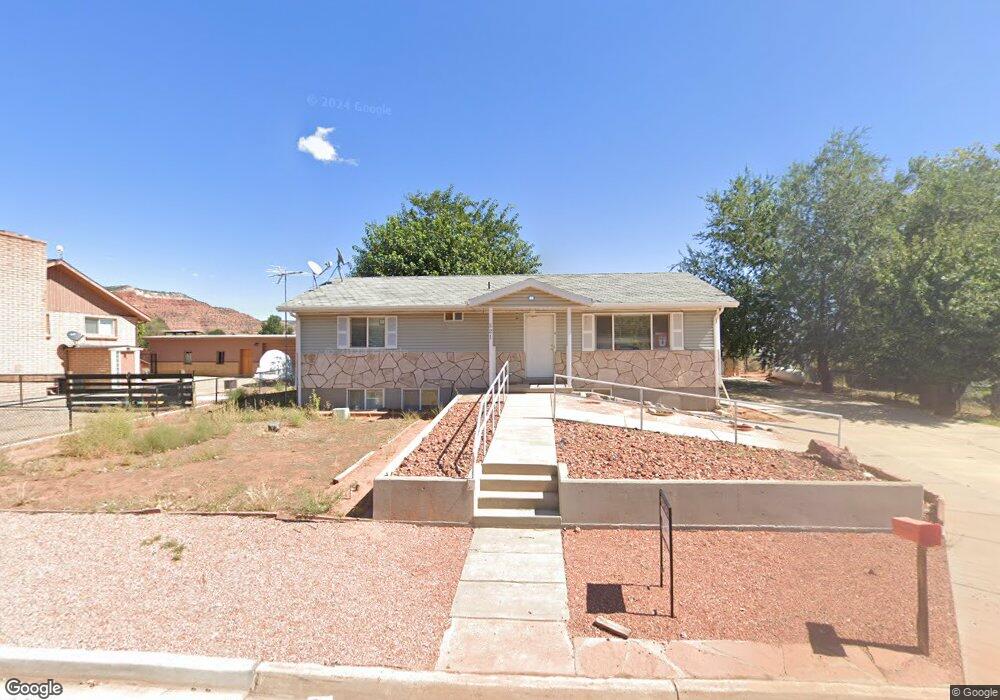
About This Home
This home is located at 521 S 475 E, Kanab, UT 84741 and is currently estimated at $467,941, approximately $195 per square foot. 521 S 475 E is a home located in Kane County with nearby schools including Kanab Elementary School, Kanab Middle School, and Kanab High School.
Ownership History
Date
Name
Owned For
Owner Type
Purchase Details
Closed on
Mar 28, 2025
Sold by
Chau Wendy
Bought by
Gallaway Nancy Ann
Current Estimated Value
Purchase Details
Closed on
Aug 22, 2019
Bought by
Luo Richard Yueyun
Purchase Details
Closed on
Jul 30, 2007
Sold by
Mace Shirley A
Bought by
Powell Lois Dorothy
Purchase Details
Closed on
Jan 27, 2006
Sold by
Mace Shirley A
Bought by
Mace Shirley A and Shirley A Mace 2006 Trust 01/27/2006
Create a Home Valuation Report for This Property
The Home Valuation Report is an in-depth analysis detailing your home's value as well as a comparison with similar homes in the area
Home Values in the Area
Average Home Value in this Area
Purchase History
| Date | Buyer | Sale Price | Title Company |
|---|---|---|---|
| Gallaway Nancy Ann | -- | -- | |
| Luo Richard Yueyun | -- | -- | |
| Powell Lois Dorothy | -- | -- | |
| Mace Shirley A | -- | -- |
Source: Public Records
Tax History
| Year | Tax Paid | Tax Assessment Tax Assessment Total Assessment is a certain percentage of the fair market value that is determined by local assessors to be the total taxable value of land and additions on the property. | Land | Improvement |
|---|---|---|---|---|
| 2025 | -- | $357,918 | $98,026 | $259,892 |
| 2024 | $2,340 | $271,902 | $48,740 | $223,162 |
| 2023 | $2,094 | $249,294 | $46,419 | $202,875 |
| 2022 | $1,867 | $220,139 | $35,707 | $184,432 |
| 2021 | $1,686 | $298,332 | $49,940 | $248,392 |
| 2020 | $1,646 | $282,783 | $45,400 | $237,383 |
| 2019 | $1,612 | $269,629 | $45,276 | $224,353 |
| 2018 | $1,580 | $262,083 | $37,730 | $224,353 |
| 2017 | $1,511 | $239,260 | $34,300 | $204,960 |
| 2016 | $1,324 | $203,595 | $34,300 | $169,295 |
| 2015 | $1,194 | $190,074 | $34,300 | $155,774 |
| 2014 | $1,194 | $182,640 | $36,771 | $145,869 |
| 2013 | -- | $100,452 | $0 | $0 |
Source: Public Records
Map
Nearby Homes
- 528 S 410 E
- 275 E 650 S Unit 5
- 1117 S Terrel Dr
- 818 S Highway 89a
- 300 S 300 E Unit A5
- 588 Cedar Cir
- 611 S 175 E
- 0 Chinle Dr
- 380 E 200 S
- 0 U S Highway 89
- 632 S Hillside Dr
- 931 S Hillside Dr
- 476 S 100 E
- 852 E Rocky Rd
- 0 100 Unit 1409231
- 442 100 South - Casita
- 442 E 100 S
- 80 E Red Shadow Cir
- 782 Country Club Dr
- 325 S Main St
Your Personal Tour Guide
Ask me questions while you tour the home.