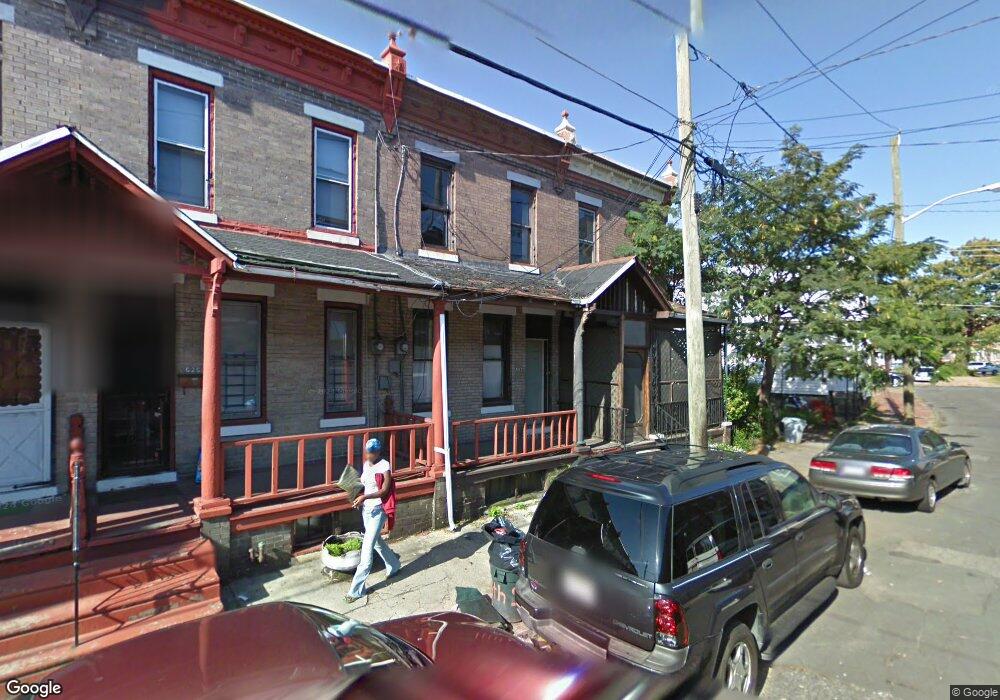
521 S 8th St Camden, NJ 08103
Lanning Square NeighborhoodEstimated Value: $91,512 - $171,000
--
Bed
--
Bath
1,311
Sq Ft
$101/Sq Ft
Est. Value
About This Home
This home is located at 521 S 8th St, Camden, NJ 08103 and is currently estimated at $132,628, approximately $101 per square foot. 521 S 8th St is a home located in Camden County with nearby schools including Camden High School, Leap Academy University Charter School, and Hope Community Charter School.
Ownership History
Date
Name
Owned For
Owner Type
Purchase Details
Closed on
Jan 10, 2023
Sold by
Sims Edward
Bought by
Headz Homes Llc
Current Estimated Value
Purchase Details
Closed on
Aug 11, 2020
Sold by
Roberts Sheila and Estate Of Lillian M Murphy
Bought by
Sims Edward
Create a Home Valuation Report for This Property
The Home Valuation Report is an in-depth analysis detailing your home's value as well as a comparison with similar homes in the area
Home Values in the Area
Average Home Value in this Area
Purchase History
| Date | Buyer | Sale Price | Title Company |
|---|---|---|---|
| Headz Homes Llc | -- | -- | |
| Sims Edward | $11,000 | None Available | |
| Shelton Desi | $3,000 | Surety Abstract Expert |
Source: Public Records
Tax History Compared to Growth
Tax History
| Year | Tax Paid | Tax Assessment Tax Assessment Total Assessment is a certain percentage of the fair market value that is determined by local assessors to be the total taxable value of land and additions on the property. | Land | Improvement |
|---|---|---|---|---|
| 2025 | $1,325 | $37,400 | $9,000 | $28,400 |
| 2024 | $1,281 | $37,400 | $9,000 | $28,400 |
| 2023 | $1,281 | $37,400 | $9,000 | $28,400 |
| 2022 | $1,257 | $37,400 | $9,000 | $28,400 |
| 2021 | $1,253 | $37,400 | $9,000 | $28,400 |
| 2020 | $1,189 | $37,400 | $9,000 | $28,400 |
| 2019 | $1,139 | $37,400 | $9,000 | $28,400 |
| 2018 | $1,133 | $37,400 | $9,000 | $28,400 |
| 2017 | $1,105 | $37,400 | $9,000 | $28,400 |
| 2016 | $1,070 | $37,400 | $9,000 | $28,400 |
| 2015 | $1,030 | $37,400 | $9,000 | $28,400 |
| 2014 | $1,005 | $37,400 | $9,000 | $28,400 |
Source: Public Records
Map
Nearby Homes
- 715 S 8th St
- 746 Pine St
- 803 Princeton Ave
- 711 Berkley St
- 700 New St Unit 308
- 724 Spruce St
- 718 Spruce St
- 917 S 8th St
- 601 Berkley St
- 918 Mount Ephraim Ave
- 764 Mount Vernon St
- 513 Benson St
- 1003 Langham Ave
- 449 S 6th St
- 1036 Princess Ave
- 1137 Sycamore St
- 418 Benson St
- 1153 Cooper St
- 1224 Chestnut St
- 507 S 4th St