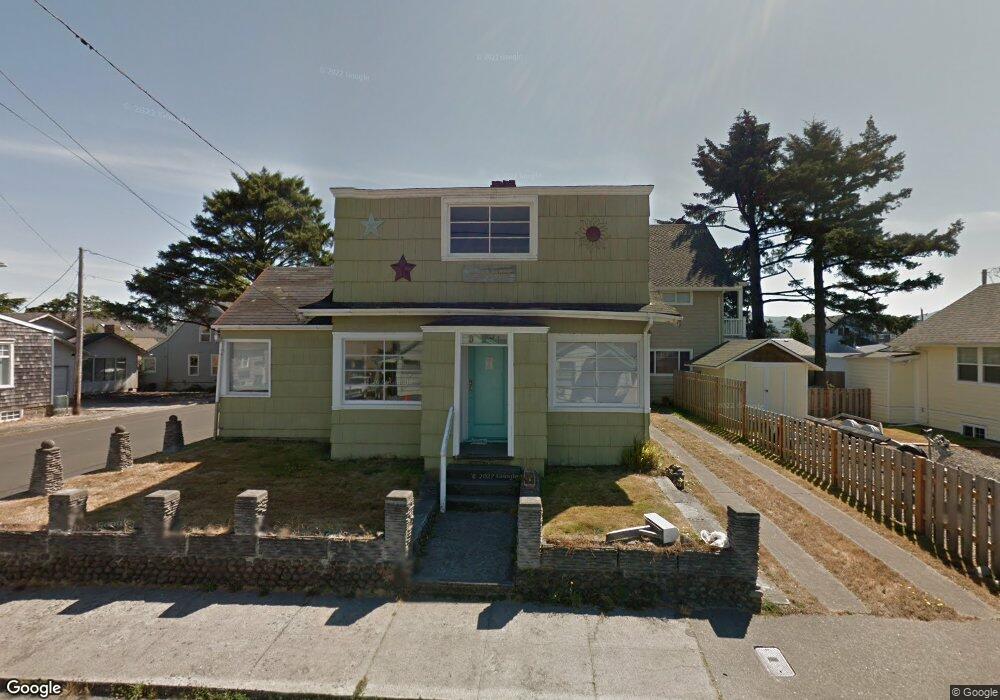
521 S Columbia Sreet Seaside, OR 97138
Estimated Value: $782,000 - $866,000
4
Beds
4
Baths
1,092
Sq Ft
$765/Sq Ft
Est. Value
About This Home
This home is located at 521 S Columbia Sreet, Seaside, OR 97138 and is currently estimated at $835,491, approximately $765 per square foot. 521 S Columbia Sreet is a home located in Clatsop County with nearby schools including Seaside High School.
Ownership History
Date
Name
Owned For
Owner Type
Purchase Details
Closed on
Nov 18, 2015
Sold by
Busse William and Busse Terri
Bought by
H & R Properties Llc
Current Estimated Value
Purchase Details
Closed on
Dec 11, 2012
Sold by
Agee Mike
Bought by
Busse William and Busse Terri
Purchase Details
Closed on
Aug 28, 2012
Sold by
Fannie Mae
Bought by
Agee Mike and Busse Terri
Purchase Details
Closed on
Dec 6, 2011
Sold by
Grimwood Harland
Bought by
Federal National Mortgage Association
Purchase Details
Closed on
Apr 17, 2008
Sold by
Grimwood Harlan
Bought by
Grimwood Harlan Z and Martin Ann Montague
Purchase Details
Closed on
Jan 30, 2008
Sold by
Armfield Douglas L and Armfield Wendy L
Bought by
Grimwood Harlan
Home Financials for this Owner
Home Financials are based on the most recent Mortgage that was taken out on this home.
Original Mortgage
$275,300
Interest Rate
6.09%
Mortgage Type
Purchase Money Mortgage
Create a Home Valuation Report for This Property
The Home Valuation Report is an in-depth analysis detailing your home's value as well as a comparison with similar homes in the area
Home Values in the Area
Average Home Value in this Area
Purchase History
| Date | Buyer | Sale Price | Title Company |
|---|---|---|---|
| H & R Properties Llc | -- | None Available | |
| Busse William | $77,450 | None Available | |
| Agee Mike | $154,900 | Ticor Title Ins Co | |
| Federal National Mortgage Association | $283,763 | None Available | |
| Grimwood Harlan Z | -- | None Available | |
| Grimwood Harlan | $305,900 | Ticor Title Insurance Co |
Source: Public Records
Mortgage History
| Date | Status | Borrower | Loan Amount |
|---|---|---|---|
| Previous Owner | Grimwood Harlan | $275,300 |
Source: Public Records
Tax History Compared to Growth
Tax History
| Year | Tax Paid | Tax Assessment Tax Assessment Total Assessment is a certain percentage of the fair market value that is determined by local assessors to be the total taxable value of land and additions on the property. | Land | Improvement |
|---|---|---|---|---|
| 2025 | $5,521 | $384,203 | -- | -- |
| 2024 | $5,359 | $373,013 | -- | -- |
| 2023 | $5,200 | $362,149 | $0 | $0 |
| 2022 | $5,058 | $351,601 | $0 | $0 |
| 2021 | $4,861 | $335,154 | $0 | $0 |
| 2020 | $4,747 | $325,393 | $0 | $0 |
| 2019 | $4,618 | $315,916 | $0 | $0 |
| 2018 | $4,435 | $306,715 | $0 | $0 |
| 2017 | $4,232 | $297,782 | $0 | $0 |
| 2016 | $3,723 | $289,110 | $60,553 | $228,557 |
| 2015 | $2,332 | $180,531 | $58,790 | $121,741 |
| 2014 | $1,909 | $145,042 | $0 | $0 |
| 2013 | -- | $140,818 | $0 | $0 |
Source: Public Records
Map
Nearby Homes
- 301 C Ave Unit 301
- 301 C Ave
- 475 S Prom Unit 114
- 475 S Prom Unit 518
- 361 S Prom Unit 502
- 475 S Promenade
- 860 Beach Dr
- 15 Avenue I
- 15 Avenue I Unit 1
- 1061 S Columbia St
- 1041 Beach Dr
- 1041 S Beach Dr SW
- TL 8700 Prom St
- 1081 S Prom
- 870 S Holladay Dr Unit 3
- 870 S Holladay Dr
- 720 Avenue G
- 720 740 Avenue G
- 500 Farrell Ct
- TL 8700 S Promenade
- 521 S Columbia St
- 225 Avenue N
- 541 S Columbia St
- 481 S Columbia St
- 100 S Prom
- 100 S Prom Unit 8834
- 100 S Prom Unit 7734E
- 100 S Prom Unit 5502
- 100 S Prom Unit 6639
- 100 S Prom Unit 5502
- 100 S Prom Unit 6633
- 100 S Prom Unit 8840
- 100 S Prom Unit 7711
- 100 S Prom Unit 7719L
- 571 S Columbia St
- 548 S Columbia St
- 480 S Columbia St
- 214 Avenue E
- 520 S Downing St
- 581 S Columbia St