Estimated Value: $393,000 - $406,000
4
Beds
2
Baths
1,577
Sq Ft
$253/Sq Ft
Est. Value
About This Home
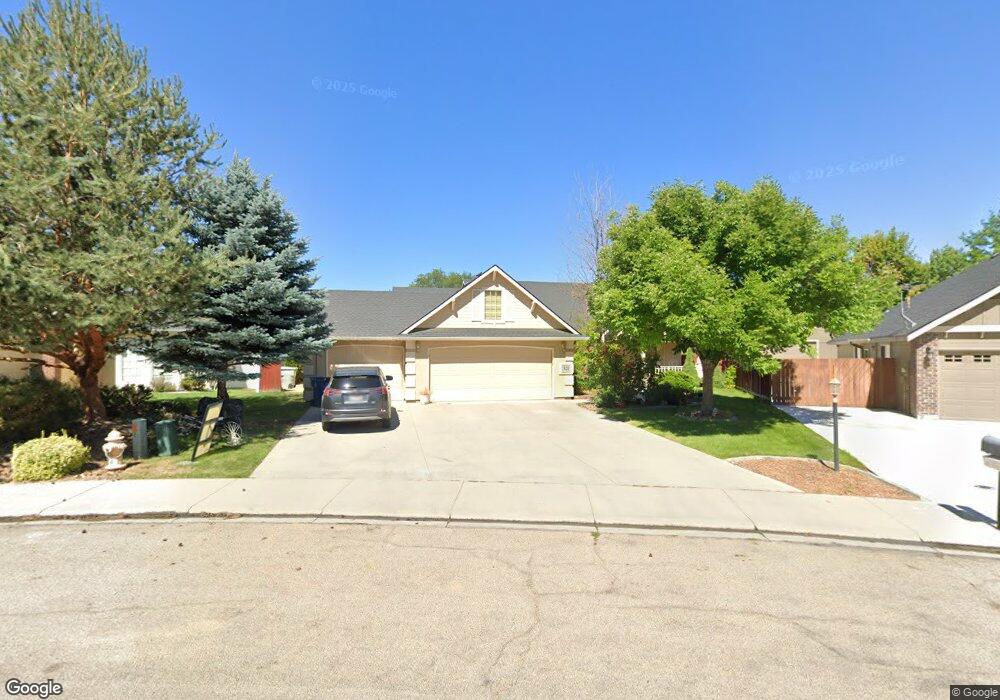
This home is located at 521 S Cool Creek Cir, Nampa, ID 83686 and is currently estimated at $399,328, approximately $253 per square foot. 521 S Cool Creek Cir is a home located in Canyon County with nearby schools including Roosevelt Elementary School, West Middle School, and Nampa Senior High School.
Ownership History
Date
Name
Owned For
Owner Type
Purchase Details
Closed on
Oct 21, 2011
Sold by
Vazquez Enrique and Ramos Lorena
Bought by
Vazquez Torres Enrique and Vazquez Ramos Lorena
Current Estimated Value
Purchase Details
Closed on
Apr 3, 2006
Sold by
Alexander Rick and Alexander Sara K
Bought by
Vazquez Enrique and Ramos Lorena
Home Financials for this Owner
Home Financials are based on the most recent Mortgage that was taken out on this home.
Original Mortgage
$181,431
Outstanding Balance
$103,296
Interest Rate
6.2%
Mortgage Type
FHA
Estimated Equity
$296,032
Purchase Details
Closed on
Mar 31, 2004
Sold by
Young American Homes Inc
Bought by
Alexander Rick and Alexander Sara K
Home Financials for this Owner
Home Financials are based on the most recent Mortgage that was taken out on this home.
Original Mortgage
$136,420
Interest Rate
7.5%
Mortgage Type
Purchase Money Mortgage
Create a Home Valuation Report for This Property
The Home Valuation Report is an in-depth analysis detailing your home's value as well as a comparison with similar homes in the area
Home Values in the Area
Average Home Value in this Area
Purchase History
| Date | Buyer | Sale Price | Title Company |
|---|---|---|---|
| Vazquez Torres Enrique | -- | Accommodation | |
| Vazquez Enrique | -- | Pioneer Title Company | |
| Alexander Rick | -- | Pioneer Title Company Of Can |
Source: Public Records
Mortgage History
| Date | Status | Borrower | Loan Amount |
|---|---|---|---|
| Open | Vazquez Enrique | $181,431 | |
| Previous Owner | Alexander Rick | $136,420 |
Source: Public Records
Tax History Compared to Growth
Tax History
| Year | Tax Paid | Tax Assessment Tax Assessment Total Assessment is a certain percentage of the fair market value that is determined by local assessors to be the total taxable value of land and additions on the property. | Land | Improvement |
|---|---|---|---|---|
| 2025 | $1,544 | $398,800 | $117,000 | $281,800 |
| 2024 | $1,544 | $374,400 | $91,000 | $283,400 |
| 2023 | $1,533 | $383,000 | $91,000 | $292,000 |
| 2022 | $3,136 | $424,900 | $117,000 | $307,900 |
| 2021 | $1,979 | $293,000 | $71,500 | $221,500 |
| 2020 | $1,752 | $235,300 | $54,500 | $180,800 |
| 2019 | $1,945 | $221,200 | $52,000 | $169,200 |
| 2018 | $1,847 | $0 | $0 | $0 |
| 2017 | $1,651 | $0 | $0 | $0 |
| 2016 | $1,565 | $0 | $0 | $0 |
| 2015 | $1,526 | $0 | $0 | $0 |
| 2014 | $1,459 | $149,700 | $30,000 | $119,700 |
Source: Public Records
Map
Nearby Homes
- 444 S Middle Creek Dr
- 1300 Lake Lowell Ave
- 1410 Spruce Creek Loop
- 1408 Lake Lowell Ave
- 722 S Bonneville Dr
- 1107 Lake Lowell Ave
- 304 Walnut Creek Way
- 238 Walnut Creek Way
- 965 W Mollywood Dr
- 604 S Midland Blvd
- 1460 W Lark Ct
- 940 W Heather Woods Dr
- 937 Hamilton Place
- The Umpqua Plan at Audrey Acres
- The Orchard Encore Plan at Audrey Acres
- The Timberline Plan at Audrey Acres
- The Orchard Plan at Audrey Acres
- The Hudson Plan at Audrey Acres
- The Canyon Plan at Audrey Acres
- 73 S Falcon Place
- 525 S Cool Creek Cir
- 517 S Cool Creek Cir
- 524 Spruce Creek Dr
- 518 Spruce Creek Dr
- 600 Spruce Creek Dr
- 529 S Cool Creek Cir
- 513 S Cool Creek Cir
- 522 S Cool Creek Cir
- 512 Spruce Creek Dr
- 604 Spruce Creek Dr
- 427 S Middle Creek Dr
- 508 Spruce Creek Dr
- 509 S Cool Creek Cir
- 510 S Cool Creek Cir
- 533 S Cool Creek Cir
- 530 S Cool Creek Cir
- 431 S Middle Creek Dr
- 525 Spruce Creek Dr
- 608 Spruce Creek Dr
- 613 Spruce Creek Dr