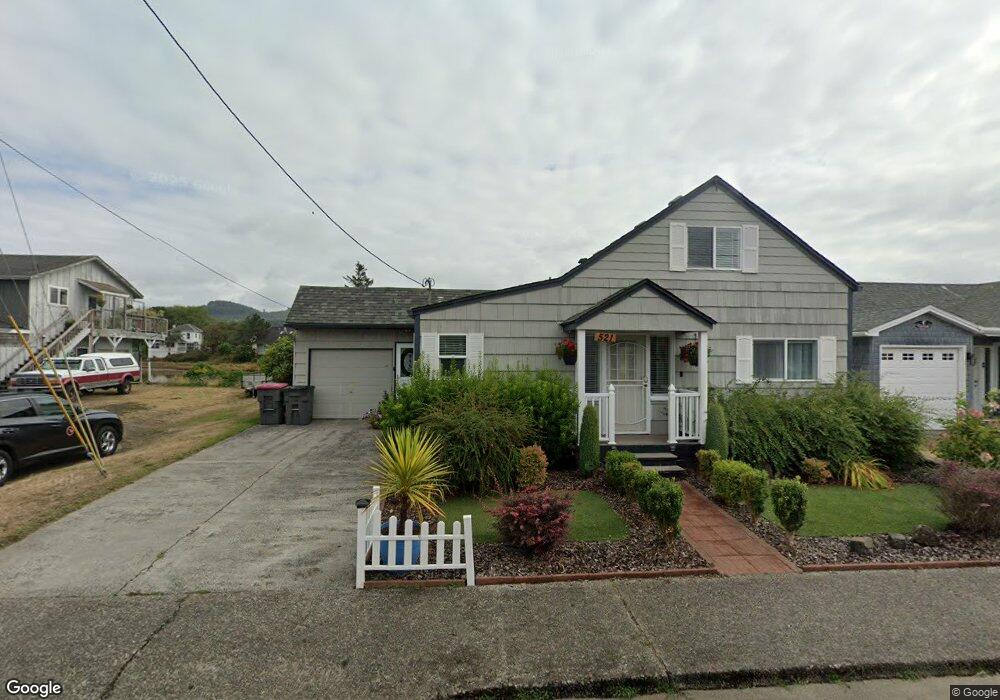
521 S Franklin St Seaside, OR 97138
Estimated Value: $443,000 - $521,000
3
Beds
1
Bath
841
Sq Ft
$581/Sq Ft
Est. Value
About This Home
This home is located at 521 S Franklin St, Seaside, OR 97138 and is currently estimated at $488,367, approximately $580 per square foot. 521 S Franklin St is a home located in Clatsop County with nearby schools including Seaside High School.
Ownership History
Date
Name
Owned For
Owner Type
Purchase Details
Closed on
Aug 16, 2021
Sold by
Stassen James Michael and Stassen Linda Jean
Bought by
Marcotte Carolyn J
Current Estimated Value
Purchase Details
Closed on
Jul 14, 2015
Sold by
Stassen James and Stassen Matthew
Bought by
The Stassen Family Trust
Purchase Details
Closed on
Mar 13, 2015
Sold by
Bartoldus Daintry
Bought by
Stassen James and Stassen Matthew
Purchase Details
Closed on
Jan 2, 2013
Sold by
Stassen Michael Roy and Stassen Janet Lee
Bought by
Bartoldus Daintry
Purchase Details
Closed on
Dec 27, 2012
Sold by
Stassen Janet
Bought by
Bartoldus Daintry
Purchase Details
Closed on
Jan 12, 2010
Sold by
Stassen Janet L
Bought by
Stassen Michael Roy and Stassen Janet Lee
Purchase Details
Closed on
Feb 29, 2008
Sold by
Stassen Michael
Bought by
Stassen Janet
Purchase Details
Closed on
Aug 12, 2006
Sold by
Stassen Michael Roy and Stassen Janet Lee
Bought by
Stassen Michael Roy and Stassen Janet Lee
Purchase Details
Closed on
Jul 11, 2005
Sold by
Stassen Matthew
Bought by
Stassen Michael
Create a Home Valuation Report for This Property
The Home Valuation Report is an in-depth analysis detailing your home's value as well as a comparison with similar homes in the area
Home Values in the Area
Average Home Value in this Area
Purchase History
| Date | Buyer | Sale Price | Title Company |
|---|---|---|---|
| Marcotte Carolyn J | $420,000 | Ticor Title Company Of Or | |
| The Stassen Family Trust | -- | None Available | |
| Stassen James | -- | None Available | |
| Bartoldus Daintry | -- | None Available | |
| Bartoldus Daintry | $110,000 | Ticor Title Ins Co | |
| Stassen Michael Roy | -- | None Available | |
| Stassen Janet | -- | None Available | |
| Stassen Michael Roy | -- | None Available | |
| Stassen Michael | -- | -- |
Source: Public Records
Tax History Compared to Growth
Tax History
| Year | Tax Paid | Tax Assessment Tax Assessment Total Assessment is a certain percentage of the fair market value that is determined by local assessors to be the total taxable value of land and additions on the property. | Land | Improvement |
|---|---|---|---|---|
| 2025 | $3,025 | $210,524 | -- | -- |
| 2024 | $2,936 | $204,393 | -- | -- |
| 2023 | $2,849 | $198,441 | $0 | $0 |
| 2022 | $2,772 | $192,662 | $0 | $0 |
| 2021 | $2,713 | $187,052 | $0 | $0 |
| 2020 | $2,650 | $181,605 | $0 | $0 |
| 2019 | $2,577 | $176,316 | $0 | $0 |
| 2018 | $2,475 | $171,181 | $0 | $0 |
| 2017 | $2,362 | $166,196 | $0 | $0 |
| 2016 | $2,073 | $161,356 | $88,017 | $73,339 |
| 2015 | $2,023 | $156,657 | $85,454 | $71,203 |
| 2014 | $2,017 | $152,096 | $0 | $0 |
| 2013 | -- | $147,667 | $0 | $0 |
Source: Public Records
Map
Nearby Homes
- 301 C Ave Unit 301
- 301 C Ave
- 870 S Holladay Dr Unit 3
- 870 S Holladay Dr
- 720 740 Avenue G
- 720 Avenue G
- 860 Beach Dr
- 1061 S Columbia St
- 500 Farrell Ct
- 475 S Prom Unit 114
- 475 S Prom Unit 518
- 1041 Beach Dr
- 15 Avenue I
- 15 Avenue I Unit 1
- 1041 S Beach Dr SW
- 1108 S Holladay Dr Unit 14
- 1108 S Holladay Dr Unit 24
- 361 S Prom Unit 502
- 475 S Promenade
- TL 8700 Prom St
- 525 S Franklin St
- 536 S Franklin St Unit 544
- 473 S Franklin St
- 536-544 S Franklin
- 560 S Franklin St
- 461-473 S Franklin St
- 580 S Franklin St
- 620 S Franklin St
- 456 S Franklin St Unit 460
- 461 S Franklin St
- 521 S Edgewood St
- 541 S Edgewood St
- 561 S Edgewood St
- 448 S Franklin St Unit 1
- 448 S Franklin St
- 420 Avenue E
- 461 S Edgewood St
- 581 S Edgewood St
- 680 S Franklin St
- 439 S Franklin St