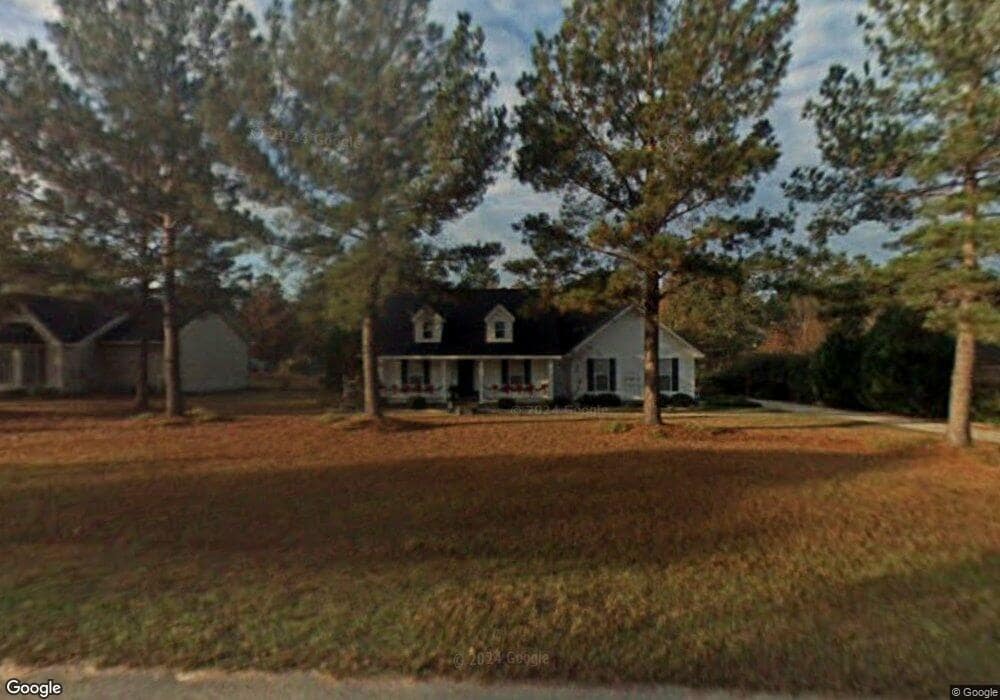
521 Saint Andrews Cir Statesboro, GA 30458
Estimated Value: $280,000 - $327,000
3
Beds
2
Baths
1,669
Sq Ft
$178/Sq Ft
Est. Value
About This Home
This home is located at 521 Saint Andrews Cir, Statesboro, GA 30458 and is currently estimated at $296,269, approximately $177 per square foot. 521 Saint Andrews Cir is a home located in Bulloch County with nearby schools including Langston Chapel Elementary School, Statesboro High School, and Langston Chapel Middle School.
Ownership History
Date
Name
Owned For
Owner Type
Purchase Details
Closed on
Dec 29, 2006
Sold by
Not Provided
Bought by
Key Daniel J and Key Cynthia S
Current Estimated Value
Home Financials for this Owner
Home Financials are based on the most recent Mortgage that was taken out on this home.
Original Mortgage
$111,200
Outstanding Balance
$65,897
Interest Rate
6.06%
Mortgage Type
New Conventional
Estimated Equity
$230,372
Purchase Details
Closed on
May 18, 2004
Bought by
Deal Michael B
Purchase Details
Closed on
Jul 1, 2003
Bought by
Hall Kelly M
Purchase Details
Closed on
Dec 1, 2001
Bought by
Clark Michael K
Purchase Details
Closed on
Sep 1, 1999
Bought by
Bolling James Andrew
Purchase Details
Closed on
May 1, 1999
Bought by
St Andrews Builders Inc
Purchase Details
Closed on
Dec 1, 1991
Bought by
Bland Mark M
Create a Home Valuation Report for This Property
The Home Valuation Report is an in-depth analysis detailing your home's value as well as a comparison with similar homes in the area
Home Values in the Area
Average Home Value in this Area
Purchase History
| Date | Buyer | Sale Price | Title Company |
|---|---|---|---|
| Key Daniel J | $139,000 | -- | |
| Deal Michael B | -- | -- | |
| Hall Kelly M | -- | -- | |
| Clark Michael K | -- | -- | |
| Bolling James Andrew | -- | -- | |
| St Andrews Builders Inc | -- | -- | |
| Bland Mark M | -- | -- |
Source: Public Records
Mortgage History
| Date | Status | Borrower | Loan Amount |
|---|---|---|---|
| Open | Key Daniel J | $111,200 | |
| Closed | Key Daniel J | $10,100 |
Source: Public Records
Tax History Compared to Growth
Tax History
| Year | Tax Paid | Tax Assessment Tax Assessment Total Assessment is a certain percentage of the fair market value that is determined by local assessors to be the total taxable value of land and additions on the property. | Land | Improvement |
|---|---|---|---|---|
| 2024 | $1,935 | $88,032 | $16,000 | $72,032 |
| 2023 | $2,021 | $84,116 | $12,000 | $72,116 |
| 2022 | $1,555 | $71,127 | $8,800 | $62,327 |
| 2021 | $1,327 | $59,190 | $8,800 | $50,390 |
| 2020 | $1,271 | $56,358 | $8,800 | $47,558 |
| 2019 | $1,246 | $54,961 | $7,280 | $47,681 |
| 2018 | $1,194 | $50,656 | $7,280 | $43,376 |
| 2017 | $1,180 | $49,509 | $7,280 | $42,229 |
| 2016 | $1,181 | $48,408 | $7,280 | $41,128 |
| 2015 | $1,149 | $46,903 | $7,280 | $39,623 |
| 2014 | $1,062 | $46,903 | $7,280 | $39,623 |
Source: Public Records
Map
Nearby Homes
- 525 Saint Andrews Cir
- 1317 Kermit Dr
- 1300 Kermit Dr
- 1503 Cayla Way
- 1501 Cayla Way
- 112 Enclave Ct
- 126 Enclave Ct
- 101 Old Barn Rd
- 315 Shallow Well Ct
- 149 Griffith Ln
- 1713 Muirfield Dr
- 369 Glazebrook Ave
- 367 Glazebrook Ave
- 365 Glazebrook Ave
- 357 Glazebrook Ave
- 355 Glazebrook Ave
- 610 Waverly Ln
- 412 Mayberry Way
- 220 Bruiser Cir
- 512 Colquitt Ln
- 523 Saint Andrews Cir
- 519 Saint Andrews Cir
- 530 Saint Andrews Cir
- 530 St Andrews
- 532 Saint Andrews Cir
- 527 Saint Andrews Cir
- 517 Saint Andrews Cir
- 540 Saint Andrews Cir
- 538 Saint Andrews Cir
- 534 Saint Andrews Cir
- 542 Saint Andrews Cir
- 536 Saint Andrews Cir
- 529 Saint Andrews Cir
- 529 Saint Andrews Cir Unit 54
- 544 Saint Andrews Cir
- 515 Saint Andrews Cir
- 546 Saint Andrews Cir
- 524 Saint Andrews Cir
- 513 Saint Andrews Cir
- 548 Saint Andrews Cir