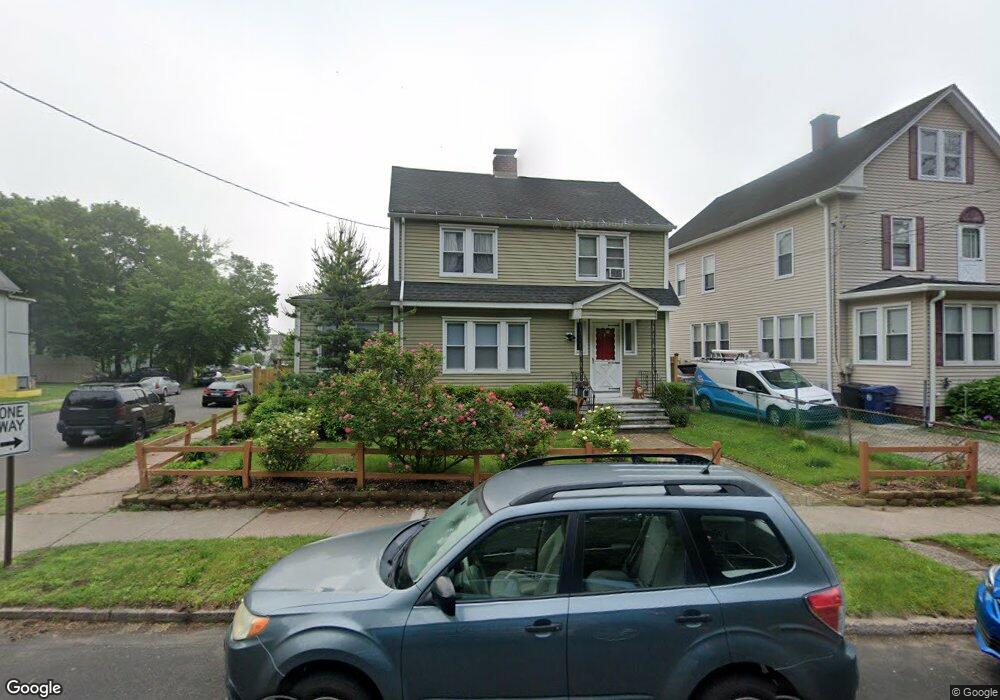
521 Savin Ave West Haven, CT 06516
West Haven Center NeighborhoodEstimated Value: $360,712 - $477,000
3
Beds
2
Baths
1,869
Sq Ft
$217/Sq Ft
Est. Value
About This Home
This home is located at 521 Savin Ave, West Haven, CT 06516 and is currently estimated at $405,428, approximately $216 per square foot. 521 Savin Ave is a home located in New Haven County with nearby schools including Carrigan 5/6 Intermediate School, Harry M. Bailey Middle School, and West Haven High School.
Ownership History
Date
Name
Owned For
Owner Type
Purchase Details
Closed on
Apr 22, 2004
Sold by
Rubenstein Thomas L and Salati-Rubenstein Joanna
Bought by
Hager Noel
Current Estimated Value
Purchase Details
Closed on
Aug 24, 2001
Sold by
Taverner Regan Prop
Bought by
Salati Joanna
Purchase Details
Closed on
Apr 25, 2001
Sold by
Residential Funding
Bought by
Taverner Regan Prop
Create a Home Valuation Report for This Property
The Home Valuation Report is an in-depth analysis detailing your home's value as well as a comparison with similar homes in the area
Home Values in the Area
Average Home Value in this Area
Purchase History
| Date | Buyer | Sale Price | Title Company |
|---|---|---|---|
| Hager Noel | $227,900 | -- | |
| Salati Joanna | $125,000 | -- | |
| Taverner Regan Prop | $103,000 | -- | |
| Residential Funding | $82,000 | -- | |
| Hager Noel | $227,900 | -- | |
| Salati Joanna | $125,000 | -- | |
| Taverner Regan Prop | $103,000 | -- |
Source: Public Records
Mortgage History
| Date | Status | Borrower | Loan Amount |
|---|---|---|---|
| Open | Taverner Regan Prop | $155,864 | |
| Closed | Taverner Regan Prop | $20,000 |
Source: Public Records
Tax History
| Year | Tax Paid | Tax Assessment Tax Assessment Total Assessment is a certain percentage of the fair market value that is determined by local assessors to be the total taxable value of land and additions on the property. | Land | Improvement |
|---|---|---|---|---|
| 2025 | $7,413 | $214,690 | $70,000 | $144,690 |
| 2024 | $6,817 | $140,490 | $48,510 | $91,980 |
| 2023 | $6,534 | $140,490 | $48,510 | $91,980 |
| 2022 | $6,406 | $140,490 | $48,510 | $91,980 |
| 2021 | $8,807 | $140,490 | $48,510 | $91,980 |
| 2020 | $8,677 | $119,560 | $44,240 | $75,320 |
| 2019 | $5,819 | $119,560 | $44,240 | $75,320 |
| 2018 | $8,680 | $119,560 | $44,240 | $75,320 |
| 2017 | $5,459 | $119,560 | $44,240 | $75,320 |
| 2016 | $5,447 | $119,560 | $44,240 | $75,320 |
| 2015 | $5,626 | $139,440 | $49,280 | $90,160 |
| 2014 | $5,592 | $139,440 | $49,280 | $90,160 |
Source: Public Records
Map
Nearby Homes
- 350 Campbell Ave
- 248 William St
- 44 Church St
- 292 Richmond Ave
- 330 Savin Ave Unit 76
- 330 Savin Ave Unit 32
- 222 Washington Ave
- 307R Washington Ave
- 341 Peck Ave
- 30 Washington Manor Ave
- 15 Court St
- 102 Brown St
- 91 Brown St
- 327 Center St
- 75 Martin St
- 285 Main St
- 241 West Walk
- 82 Noble St
- 268 3rd Ave
- 2 Treadwell St
Your Personal Tour Guide
Ask me questions while you tour the home.