Estimated Value: $514,832 - $541,000
3
Beds
2
Baths
1,667
Sq Ft
$319/Sq Ft
Est. Value
About This Home
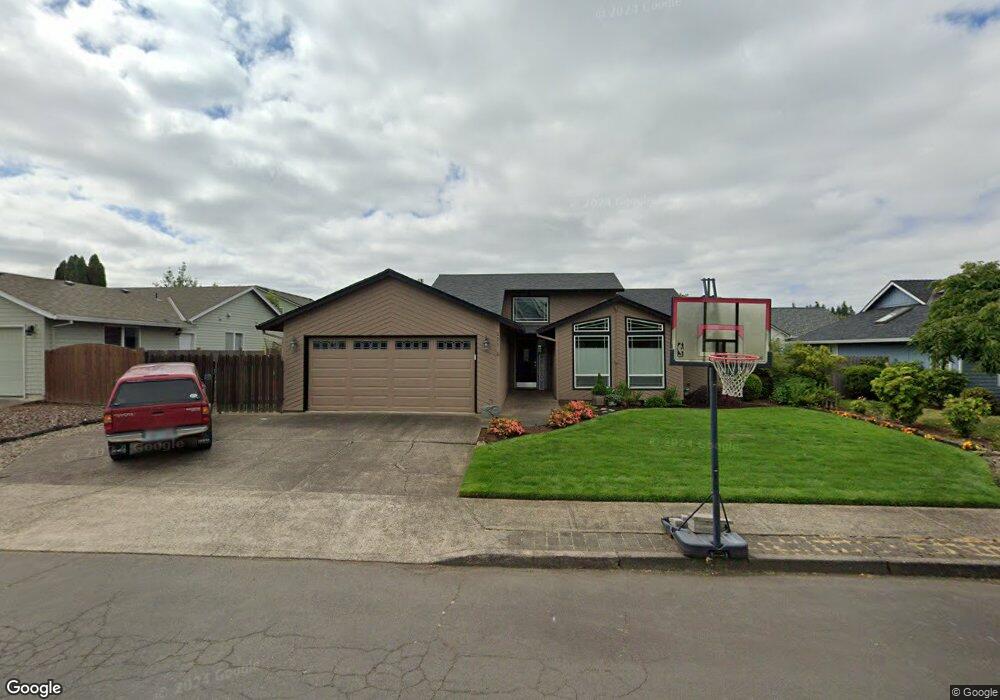
This home is located at 521 SE 7th Ave, Canby, OR 97013 and is currently estimated at $532,458, approximately $319 per square foot. 521 SE 7th Ave is a home located in Clackamas County with nearby schools including Josefa L. Sambrano Elementary School, Philander Lee Elementary School, and Baker Prairie Middle School.
Ownership History
Date
Name
Owned For
Owner Type
Purchase Details
Closed on
Sep 6, 2007
Sold by
Schar Gregory A
Bought by
Michaels Jason J and Michaels Stephanie A
Current Estimated Value
Home Financials for this Owner
Home Financials are based on the most recent Mortgage that was taken out on this home.
Original Mortgage
$239,200
Outstanding Balance
$151,527
Interest Rate
6.67%
Mortgage Type
Purchase Money Mortgage
Estimated Equity
$380,931
Purchase Details
Closed on
Jul 14, 2003
Sold by
Schar Robin L
Bought by
Schar Gregory A
Home Financials for this Owner
Home Financials are based on the most recent Mortgage that was taken out on this home.
Original Mortgage
$125,000
Interest Rate
5.18%
Mortgage Type
Purchase Money Mortgage
Purchase Details
Closed on
Aug 14, 1997
Sold by
Dickinson Earle W and Dickinson Donna M
Bought by
Schar Gregory A and Schar Robin L
Home Financials for this Owner
Home Financials are based on the most recent Mortgage that was taken out on this home.
Original Mortgage
$139,600
Interest Rate
7.45%
Create a Home Valuation Report for This Property
The Home Valuation Report is an in-depth analysis detailing your home's value as well as a comparison with similar homes in the area
Home Values in the Area
Average Home Value in this Area
Purchase History
| Date | Buyer | Sale Price | Title Company |
|---|---|---|---|
| Michaels Jason J | $299,000 | Chicago Title Insurance Co | |
| Schar Gregory A | -- | Stewart Title | |
| Schar Gregory A | $174,500 | Chicago Title Insurance Co |
Source: Public Records
Mortgage History
| Date | Status | Borrower | Loan Amount |
|---|---|---|---|
| Open | Michaels Jason J | $239,200 | |
| Previous Owner | Schar Gregory A | $125,000 | |
| Previous Owner | Schar Gregory A | $139,600 |
Source: Public Records
Tax History Compared to Growth
Tax History
| Year | Tax Paid | Tax Assessment Tax Assessment Total Assessment is a certain percentage of the fair market value that is determined by local assessors to be the total taxable value of land and additions on the property. | Land | Improvement |
|---|---|---|---|---|
| 2025 | $5,127 | $289,416 | -- | -- |
| 2024 | $4,984 | $280,987 | -- | -- |
| 2023 | $4,984 | $272,803 | $0 | $0 |
| 2022 | $4,584 | $264,858 | $0 | $0 |
| 2021 | $4,414 | $257,144 | $0 | $0 |
| 2020 | $4,335 | $249,655 | $0 | $0 |
| 2019 | $4,128 | $242,384 | $0 | $0 |
| 2018 | $4,036 | $235,324 | $0 | $0 |
| 2017 | $3,934 | $228,470 | $0 | $0 |
| 2016 | $3,803 | $221,816 | $0 | $0 |
| 2015 | $3,672 | $215,355 | $0 | $0 |
| 2014 | $3,566 | $209,083 | $0 | $0 |
Source: Public Records
Map
Nearby Homes
- 423 SE 7th Ave
- 387 SE 7th Ave
- 575 S Ponderosa St
- 582 S Maple St
- 363 SE 7th Ave
- 331 SE 9th Ave
- 1460 SE 9th Ave
- 385 SE Township Rd
- 550 SE 5th Ave
- 486 S Knott St
- 1111 SE 3rd Ave Unit 74
- 248 SE Township Rd
- 574 S Ivy St
- 620 SE 2nd Ave
- 620 SE 2nd Ave Unit 11
- 1409 S Maple St
- 835 SE 1st Ave Unit 64
- 835 SE 1st Ave Unit 14
- 835 SE 1st Ave Unit 12
- 835 SE 1st Ave Unit 17
- 649 SE 7th Ave
- 517 SE 7th Ave
- 520 SE 8th Ave
- 562 SE 8th Ave
- 490 SE 8th Ave
- 757 SE 7th Ave
- 526 SE 7th Ave
- 507 SE 7th Ave
- 514 SE 7th Ave
- 648 SE 7th Ave
- 584 SE 8th Ave
- 472 SE 8th Ave
- 502 SE 7th Ave
- 752 SE 7th Ave
- 837 SE 7th Ave
- 481 SE 7th Ave
- 665 SE 7th Place
- 452 SE 8th Ave
- 499 SE 8th Ave
- 626 SE 8th Ave