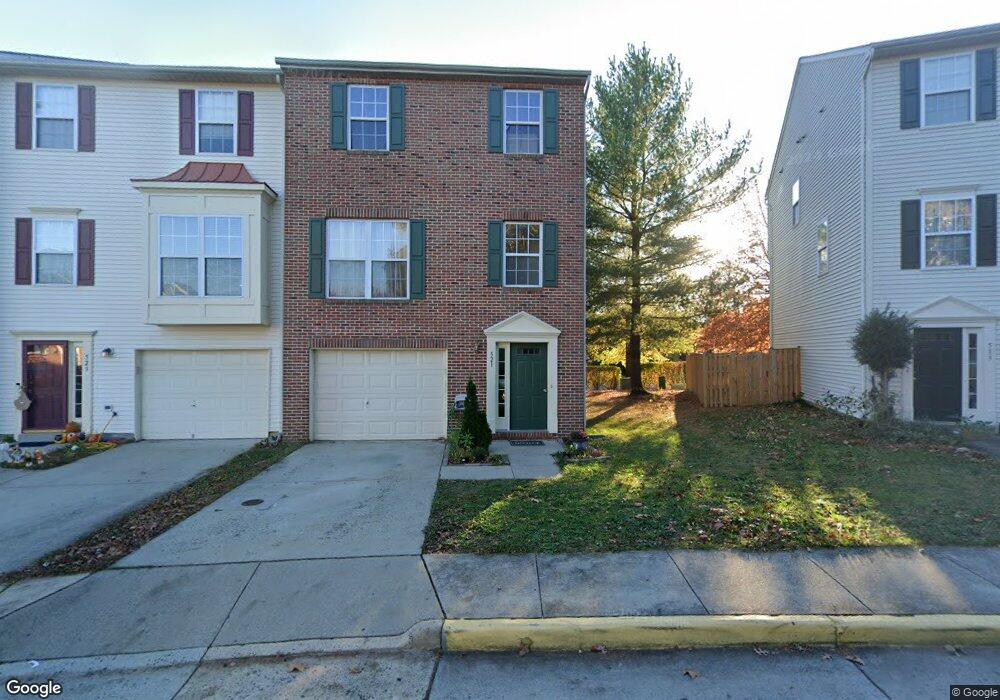
521 Sparkleberry Terrace NE Leesburg, VA 20176
Estimated Value: $540,000 - $579,000
3
Beds
3
Baths
1,996
Sq Ft
$279/Sq Ft
Est. Value
About This Home
This home is located at 521 Sparkleberry Terrace NE, Leesburg, VA 20176 and is currently estimated at $557,460, approximately $279 per square foot. 521 Sparkleberry Terrace NE is a home located in Loudoun County with nearby schools including Frederick Douglass Elementary School, Harper Park Middle School, and Heritage High School.
Ownership History
Date
Name
Owned For
Owner Type
Purchase Details
Closed on
Jun 2, 2004
Sold by
Combs Kristopher
Bought by
Le Lynn Thuy
Current Estimated Value
Home Financials for this Owner
Home Financials are based on the most recent Mortgage that was taken out on this home.
Original Mortgage
$257,600
Outstanding Balance
$125,418
Interest Rate
5.94%
Mortgage Type
New Conventional
Estimated Equity
$432,042
Purchase Details
Closed on
Sep 19, 2001
Sold by
Hill Lara Nichole
Bought by
Cross Kristopher and Combs,Thomas L
Home Financials for this Owner
Home Financials are based on the most recent Mortgage that was taken out on this home.
Original Mortgage
$208,254
Interest Rate
6.98%
Purchase Details
Closed on
Nov 30, 2000
Sold by
Oak Ridge Inc
Bought by
Hill Lara N
Home Financials for this Owner
Home Financials are based on the most recent Mortgage that was taken out on this home.
Original Mortgage
$170,278
Interest Rate
7.76%
Create a Home Valuation Report for This Property
The Home Valuation Report is an in-depth analysis detailing your home's value as well as a comparison with similar homes in the area
Home Values in the Area
Average Home Value in this Area
Purchase History
| Date | Buyer | Sale Price | Title Company |
|---|---|---|---|
| Le Lynn Thuy | $322,000 | -- | |
| Cross Kristopher | $209,900 | -- | |
| Hill Lara N | $171,209 | -- |
Source: Public Records
Mortgage History
| Date | Status | Borrower | Loan Amount |
|---|---|---|---|
| Open | Le Lynn Thuy | $257,600 | |
| Previous Owner | Cross Kristopher | $208,254 | |
| Previous Owner | Hill Lara N | $170,278 |
Source: Public Records
Tax History Compared to Growth
Tax History
| Year | Tax Paid | Tax Assessment Tax Assessment Total Assessment is a certain percentage of the fair market value that is determined by local assessors to be the total taxable value of land and additions on the property. | Land | Improvement |
|---|---|---|---|---|
| 2025 | $4,454 | $553,340 | $163,500 | $389,840 |
| 2024 | $4,433 | $512,520 | $163,500 | $349,020 |
| 2023 | $4,274 | $488,510 | $163,500 | $325,010 |
| 2022 | $3,998 | $449,210 | $128,500 | $320,710 |
| 2021 | $3,999 | $408,070 | $123,500 | $284,570 |
| 2020 | $3,926 | $379,320 | $123,500 | $255,820 |
| 2019 | $3,799 | $363,510 | $123,500 | $240,010 |
| 2018 | $3,664 | $337,650 | $93,500 | $244,150 |
| 2017 | $3,702 | $329,050 | $93,500 | $235,550 |
| 2016 | $3,678 | $321,250 | $0 | $0 |
| 2015 | $571 | $218,720 | $0 | $218,720 |
| 2014 | $569 | $217,290 | $0 | $217,290 |
Source: Public Records
Map
Nearby Homes
- 510 Ginkgo Terrace NE
- 581 Kalmia Square NE
- 535 Legrace Terrace NE
- 573 Tuliptree Square NE
- 817 Sawback Square NE
- 700 Mount Airy Terrace NE Unit 405
- 700 Mount Airy Terrace NE Unit 403
- 700 Mount Airy Terrace NE Unit 104
- 700 Mount Airy Terrace NE Unit 302
- 750 Mount Airy Terrace NE Unit 304
- 750 Mount Airy Terrace NE Unit 403
- 750 Mount Airy Terrace NE Unit 206
- 750 Mount Airy Terrace NE Unit 205
- 750 Mount Airy Terrace NE Unit 402
- 750 Mount Airy Terrace NE Unit 104
- 1008 Galena Terrace NE
- 18483 Wide Meadow Square
- Roseland Plan at Cattail Run - Grand
- Deer Valley Plan at Cattail Run - Grand
- Skyview Plan at Cattail Run - Grand
- 523 Sparkleberry Terrace NE
- 513 Sparkleberry Terrace NE
- 511 Sparkleberry Terrace NE
- 527 Sparkleberry Terrace NE
- 509 Sparkleberry Terrace NE
- 529 Sparkleberry Terrace NE
- 507 Sparkleberry Terrace NE
- 531 Sparkleberry Terrace NE
- 516 Sparkleberry Terrace NE
- 514 Sparkleberry Terrace NE
- 512 Sparkleberry Terrace NE
- 505 Sparkleberry Terrace NE
- 533 Sparkleberry Terrace NE
- 510 Sparkleberry Terrace NE
- 508 Sparkleberry Terrace NE
- 535 Sparkleberry Terrace NE
- 506 Sparkleberry Terrace NE
- 501 Sparkleberry Terrace NE
- 537 Sparkleberry Terrace NE
- 504 Sparkleberry Terrace NE