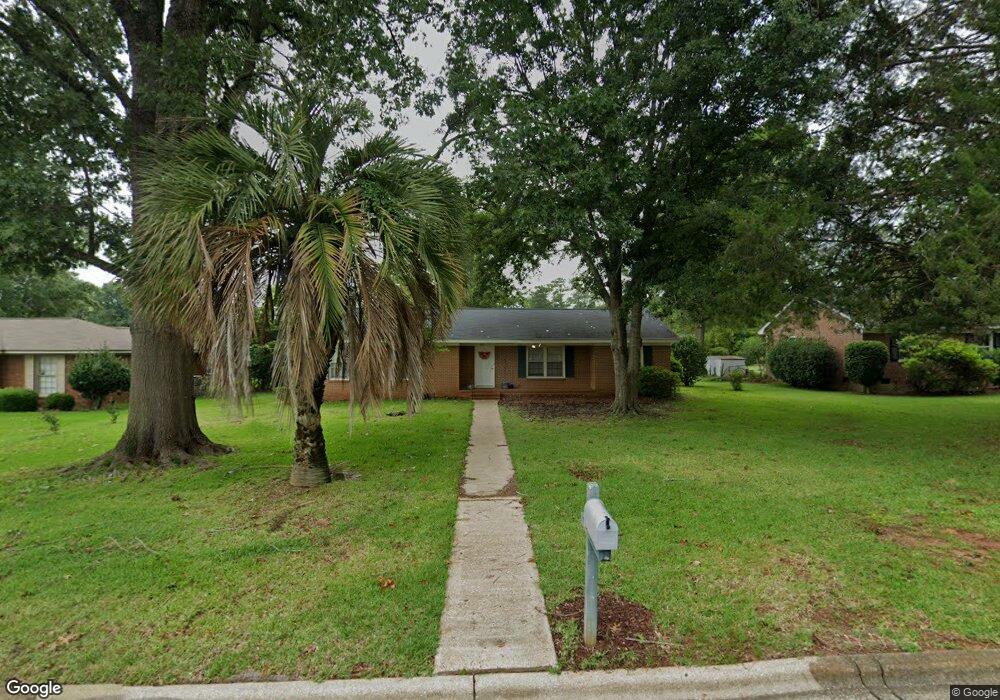
521 Summit Dr Albany, GA 31707
Lake Park NeighborhoodEstimated Value: $194,000 - $237,000
3
Beds
2
Baths
1,758
Sq Ft
$121/Sq Ft
Est. Value
About This Home
This home is located at 521 Summit Dr, Albany, GA 31707 and is currently estimated at $212,011, approximately $120 per square foot. 521 Summit Dr is a home located in Dougherty County with nearby schools including Lake Park Elementary School, Merry Acres Middle School, and Westover High School.
Ownership History
Date
Name
Owned For
Owner Type
Purchase Details
Closed on
Jul 29, 2022
Sold by
Exreo Svcs Llc
Bought by
Grafius William S
Current Estimated Value
Home Financials for this Owner
Home Financials are based on the most recent Mortgage that was taken out on this home.
Original Mortgage
$183,121
Outstanding Balance
$175,334
Interest Rate
5.7%
Mortgage Type
FHA
Estimated Equity
$36,677
Purchase Details
Closed on
Feb 11, 2022
Sold by
North American Equity Grp Llc
Bought by
Exreo Svcs Llc
Purchase Details
Closed on
May 12, 2021
Sold by
Cascade Funding Mtg Trust Hb1
Bought by
North American Equity Grp Llc
Purchase Details
Closed on
Feb 2, 2021
Sold by
Bank Of New York Mellon Trust Co Na Trus
Bought by
Cascade Funding Mtg Trust Hb1 and C/O Loss Mitigation Department
Purchase Details
Closed on
Jul 26, 1992
Sold by
Gray Terrell Hoyt
Bought by
Griffin Myra Joy G
Purchase Details
Closed on
Nov 7, 1979
Sold by
Gray Gray T and Gray H
Bought by
Gray Terrell H
Create a Home Valuation Report for This Property
The Home Valuation Report is an in-depth analysis detailing your home's value as well as a comparison with similar homes in the area
Home Values in the Area
Average Home Value in this Area
Purchase History
| Date | Buyer | Sale Price | Title Company |
|---|---|---|---|
| Grafius William S | $186,500 | -- | |
| Exreo Svcs Llc | -- | -- | |
| North American Equity Grp Llc | $83,000 | -- | |
| Cascade Funding Mtg Trust Hb1 | $83,000 | -- | |
| Bank Of New York Mellon Trust Co Na Trus | -- | -- | |
| Griffin Myra Joy G | -- | -- | |
| Gray Terrell H | -- | -- |
Source: Public Records
Mortgage History
| Date | Status | Borrower | Loan Amount |
|---|---|---|---|
| Open | Grafius William S | $183,121 |
Source: Public Records
Tax History Compared to Growth
Tax History
| Year | Tax Paid | Tax Assessment Tax Assessment Total Assessment is a certain percentage of the fair market value that is determined by local assessors to be the total taxable value of land and additions on the property. | Land | Improvement |
|---|---|---|---|---|
| 2024 | $2,496 | $52,320 | $9,520 | $42,800 |
| 2023 | $2,438 | $52,320 | $9,520 | $42,800 |
| 2022 | $1,553 | $45,160 | $9,520 | $35,640 |
| 2021 | $1,958 | $45,160 | $9,520 | $35,640 |
| 2020 | $1,679 | $45,160 | $9,520 | $35,640 |
| 2019 | $1,686 | $45,160 | $9,520 | $35,640 |
| 2018 | $1,712 | $45,600 | $9,520 | $36,080 |
| 2017 | $1,587 | $45,600 | $9,520 | $36,080 |
| 2016 | $1,588 | $45,600 | $9,520 | $36,080 |
| 2015 | $1,590 | $45,600 | $9,520 | $36,080 |
| 2014 | $1,567 | $45,600 | $9,520 | $36,080 |
Source: Public Records
Map
Nearby Homes
- 418 Meadowlark Dr
- 1814 Green Valley Ln
- 1826 Green Valley Ln
- 427 S Audubon Dr
- 00 Gillionville Rd
- 1812 Robinhood Rd
- 415 Forest Glen Dr
- 2200 Gillionville Rd
- 1802 W Lakeridge Dr
- 1813 Gillionville Rd
- 510 Flamingo Ln
- 608 Russell Rd
- 2508 Pheasant Dr
- 1009 Summit Dr
- 1728 Lynwood Ln
- 612 Russell Rd
- 2613 Partridge Dr
- 2506 Ridgewood Ln
- 2012 W Lakeridge Dr
- 1021 Summit Dr
- 523 Summit Dr
- 519 Summit Dr
- 525 Summit Dr
- 516 Summit Dr
- 410 Meadowlark Dr
- 514 Summit Dr
- 412 Meadowlark Dr
- 518 Summit Dr
- 517 Summit Dr
- 408 Meadowlark Dr
- 414 Meadowlark Dr
- 520 Summit Dr
- 512 Summit Dr
- 406 Meadowlark Dr
- 515 Summit Dr
- 1807 Green Valley Ln
- 601 Summit Dr
- 1805 Green Valley Ln
- 600 Summit Dr
- 416 Meadowlark Dr