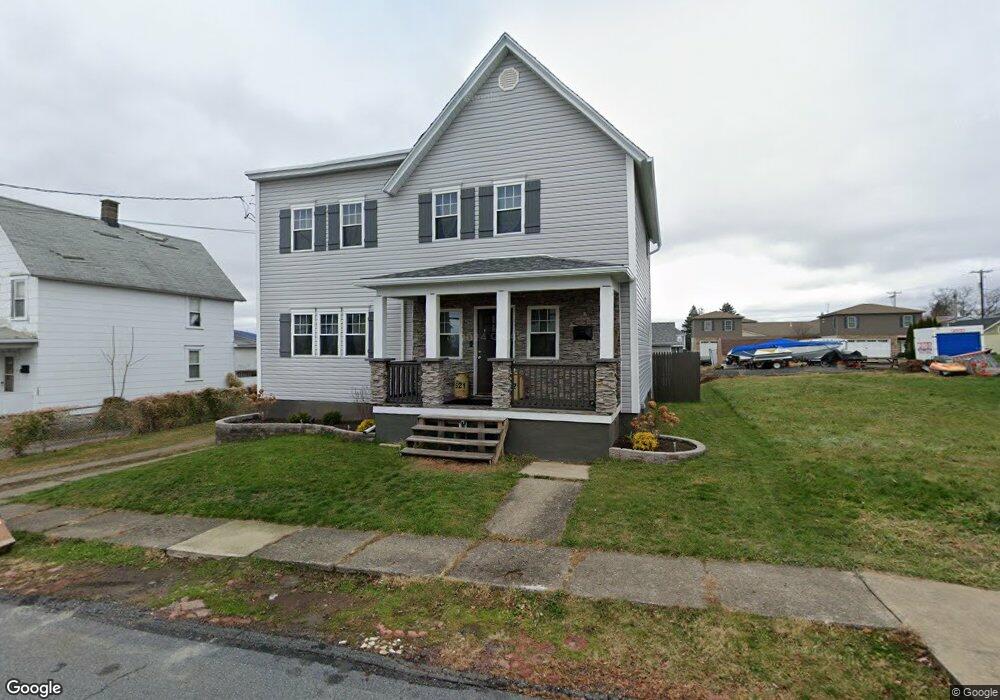
521 Throop St Dunmore, PA 18512
Estimated Value: $193,000 - $277,000
3
Beds
1
Bath
1,500
Sq Ft
$145/Sq Ft
Est. Value
About This Home
This home is located at 521 Throop St, Dunmore, PA 18512 and is currently estimated at $217,250, approximately $144 per square foot. 521 Throop St is a home located in Lackawanna County with nearby schools including Red Mountain School, Dunmore Elementary Center, and St. Mary of Mount Carmel School.
Ownership History
Date
Name
Owned For
Owner Type
Purchase Details
Closed on
Jun 9, 2016
Sold by
Us Bank
Bought by
Luongo Angelo
Current Estimated Value
Home Financials for this Owner
Home Financials are based on the most recent Mortgage that was taken out on this home.
Original Mortgage
$79,328
Outstanding Balance
$63,198
Interest Rate
3.6%
Estimated Equity
$154,052
Purchase Details
Closed on
Mar 28, 2016
Sold by
Us Bank National Association
Bought by
Luongo Angelo
Purchase Details
Closed on
Dec 29, 2005
Sold by
Bennett Julie Flis and Bennett William
Bought by
Lopez Isidro and Lopez Monica
Home Financials for this Owner
Home Financials are based on the most recent Mortgage that was taken out on this home.
Original Mortgage
$137,800
Interest Rate
6.28%
Mortgage Type
Adjustable Rate Mortgage/ARM
Create a Home Valuation Report for This Property
The Home Valuation Report is an in-depth analysis detailing your home's value as well as a comparison with similar homes in the area
Home Values in the Area
Average Home Value in this Area
Purchase History
| Date | Buyer | Sale Price | Title Company |
|---|---|---|---|
| Luongo Angelo | -- | -- | |
| Luongo Angelo | $43,000 | None Available | |
| Lopez Isidro | $137,800 | None Available |
Source: Public Records
Mortgage History
| Date | Status | Borrower | Loan Amount |
|---|---|---|---|
| Open | Luongo Angelo | $79,328 | |
| Closed | Luongo Angelo | -- | |
| Previous Owner | Lopez Isidro | $137,800 |
Source: Public Records
Tax History Compared to Growth
Tax History
| Year | Tax Paid | Tax Assessment Tax Assessment Total Assessment is a certain percentage of the fair market value that is determined by local assessors to be the total taxable value of land and additions on the property. | Land | Improvement |
|---|---|---|---|---|
| 2025 | $3,074 | $10,300 | $1,250 | $9,050 |
| 2024 | $2,628 | $10,300 | $1,250 | $9,050 |
| 2023 | $2,628 | $10,300 | $1,250 | $9,050 |
| 2022 | $2,465 | $10,300 | $1,250 | $9,050 |
| 2021 | $2,416 | $10,300 | $1,250 | $9,050 |
| 2020 | $2,416 | $10,300 | $1,250 | $9,050 |
| 2019 | $2,311 | $10,300 | $1,250 | $9,050 |
| 2018 | $2,273 | $10,300 | $1,250 | $9,050 |
| 2017 | $2,207 | $10,300 | $1,250 | $9,050 |
| 2016 | $1,163 | $10,300 | $1,250 | $9,050 |
| 2015 | -- | $10,300 | $1,250 | $9,050 |
| 2014 | -- | $10,300 | $1,250 | $9,050 |
Source: Public Records
Map
Nearby Homes
- 305 Reeves St
- 427 E Warren St
- 604 Marjorie Dr
- 618 Shirley Ln
- 314 E Drinker St
- 213 N Apple St
- 212 E Elm St
- 219 E Elm St
- 216 Prospect St
- 715 Moritz St
- 225, 233 E 301 East Drinker Stret
- 115 W Warren St
- 322 Oak St
- 141 Walnut St
- 201 Church St
- 350 Smith St Unit L 70
- 410 Smith St
- 503 Smith St
- 507 Smith St
- 1715 Quincy Ave
- 525 Throop St
- 513 Throop St
- 520 Sherwood Ave
- 511 Throop St
- 529 Throop St
- 520 Sherwood Ave
- 520 Sherwood Ave
- 520 Sherwood Ave
- 520 Sherwood Ave
- 520 Sherwood Ave
- 520 Sherwood Ave
- 307 Reeves St
- 530 Sherwood Ave Unit 2
- 530 Sherwood Ave
- 530 Sherwood Unit 6 Ave
- 509 Throop St
- 524 Throop St
- 507 Throop St
- 520 Throop St
- 522 Throop St