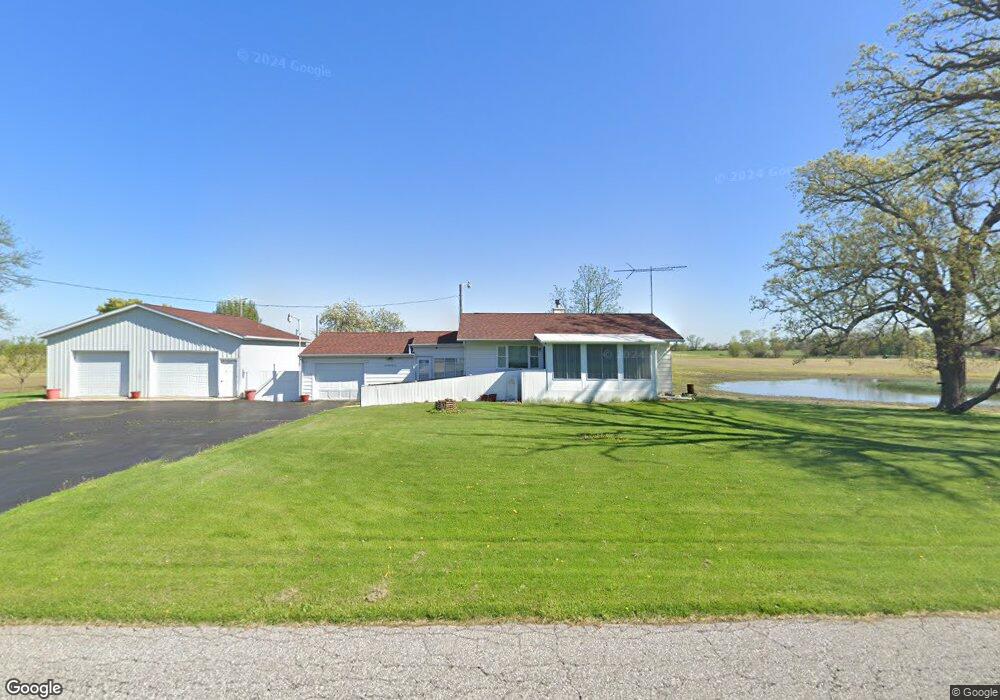
521 W 450 N Hobart, IN 46342
Estimated Value: $245,430 - $298,000
2
Beds
1
Bath
940
Sq Ft
$293/Sq Ft
Est. Value
About This Home
This home is located at 521 W 450 N, Hobart, IN 46342 and is currently estimated at $275,608, approximately $293 per square foot. 521 W 450 N is a home located in Porter County with nearby schools including Union Township Middle School, Wheeler High School, and Emmanuel Baptist Academy.
Ownership History
Date
Name
Owned For
Owner Type
Purchase Details
Closed on
Dec 14, 2023
Sold by
Sikorski Agnes S
Bought by
Sikorski Agnes S and Sikorski Agnes S
Current Estimated Value
Purchase Details
Closed on
Aug 17, 2007
Sold by
Mcilvenna Randy D
Bought by
Raelson Lori
Home Financials for this Owner
Home Financials are based on the most recent Mortgage that was taken out on this home.
Original Mortgage
$175,249
Interest Rate
6.79%
Mortgage Type
FHA
Create a Home Valuation Report for This Property
The Home Valuation Report is an in-depth analysis detailing your home's value as well as a comparison with similar homes in the area
Home Values in the Area
Average Home Value in this Area
Purchase History
| Date | Buyer | Sale Price | Title Company |
|---|---|---|---|
| Sikorski Agnes S | -- | None Listed On Document | |
| Raelson Lori | -- | Suburban Title |
Source: Public Records
Mortgage History
| Date | Status | Borrower | Loan Amount |
|---|---|---|---|
| Previous Owner | Raelson Lori | $175,249 |
Source: Public Records
Tax History Compared to Growth
Tax History
| Year | Tax Paid | Tax Assessment Tax Assessment Total Assessment is a certain percentage of the fair market value that is determined by local assessors to be the total taxable value of land and additions on the property. | Land | Improvement |
|---|---|---|---|---|
| 2024 | $1,380 | $216,000 | $37,400 | $178,600 |
| 2023 | $1,186 | $191,400 | $32,500 | $158,900 |
| 2022 | $1,046 | $176,600 | $32,500 | $144,100 |
| 2021 | $919 | $145,300 | $32,500 | $112,800 |
| 2020 | $855 | $135,700 | $28,500 | $107,200 |
| 2019 | $784 | $127,300 | $28,500 | $98,800 |
| 2018 | $817 | $123,200 | $28,500 | $94,700 |
| 2017 | $1,064 | $156,800 | $28,500 | $128,300 |
| 2016 | $1,030 | $153,500 | $29,100 | $124,400 |
| 2014 | $915 | $144,600 | $27,200 | $117,400 |
| 2013 | -- | $148,900 | $30,100 | $118,800 |
Source: Public Records
Map
Nearby Homes