Estimated Value: $241,847 - $266,000
3
Beds
2
Baths
1,208
Sq Ft
$210/Sq Ft
Est. Value
About This Home
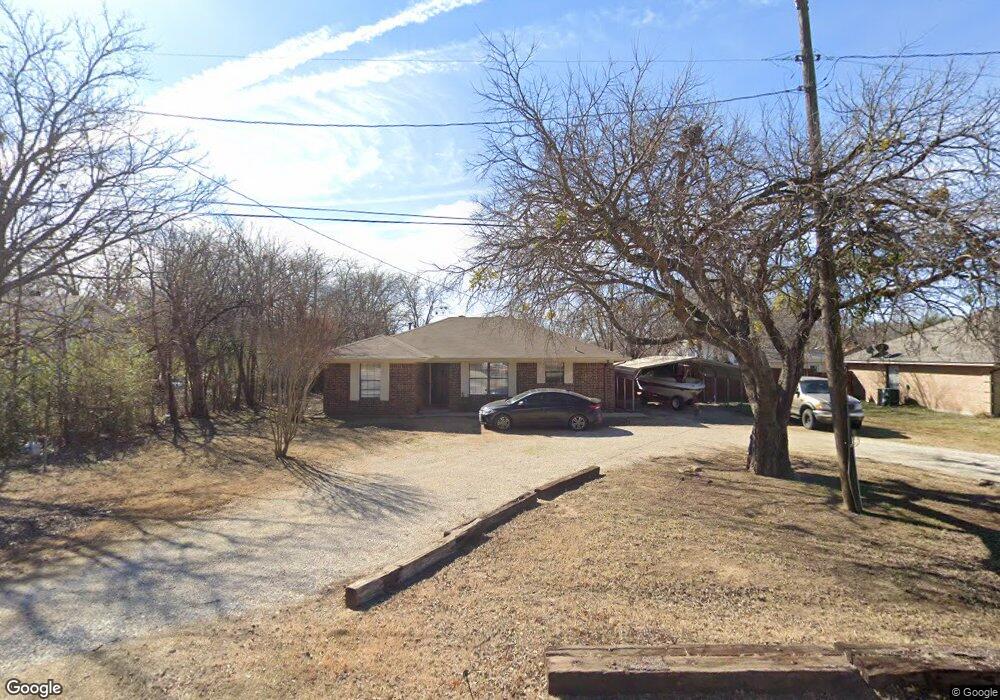
This home is located at 521 W Lloyd St, Krum, TX 76249 and is currently estimated at $253,962, approximately $210 per square foot. 521 W Lloyd St is a home located in Denton County with nearby schools including Krum Early Education Center, Dyer Elementary School, and Krum Middle School.
Ownership History
Date
Name
Owned For
Owner Type
Purchase Details
Closed on
Jun 17, 2019
Sold by
Cook Properties Llc
Bought by
Hernandez Hector
Current Estimated Value
Home Financials for this Owner
Home Financials are based on the most recent Mortgage that was taken out on this home.
Original Mortgage
$168,884
Outstanding Balance
$152,384
Interest Rate
5.5%
Mortgage Type
FHA
Estimated Equity
$101,578
Purchase Details
Closed on
Jan 22, 2019
Sold by
Simmons Weldon D and Simmons Bobbie G
Bought by
Westoplex Renewal Company Llc
Purchase Details
Closed on
Jan 14, 2005
Sold by
Howell Charles W and Howell Kami D
Bought by
Simmons Weldon D and Simmons Bobbie G
Home Financials for this Owner
Home Financials are based on the most recent Mortgage that was taken out on this home.
Original Mortgage
$79,200
Interest Rate
5.71%
Mortgage Type
Stand Alone First
Create a Home Valuation Report for This Property
The Home Valuation Report is an in-depth analysis detailing your home's value as well as a comparison with similar homes in the area
Home Values in the Area
Average Home Value in this Area
Purchase History
| Date | Buyer | Sale Price | Title Company |
|---|---|---|---|
| Hernandez Hector | -- | Freedom Title | |
| Westoplex Renewal Company Llc | -- | Alamo Title | |
| Simmons Weldon D | -- | Fidelity National Title |
Source: Public Records
Mortgage History
| Date | Status | Borrower | Loan Amount |
|---|---|---|---|
| Open | Hernandez Hector | $168,884 | |
| Previous Owner | Simmons Weldon D | $79,200 |
Source: Public Records
Tax History
| Year | Tax Paid | Tax Assessment Tax Assessment Total Assessment is a certain percentage of the fair market value that is determined by local assessors to be the total taxable value of land and additions on the property. | Land | Improvement |
|---|---|---|---|---|
| 2025 | $3,733 | $230,171 | $70,875 | $159,296 |
| 2024 | $4,972 | $246,724 | $70,875 | $175,849 |
| 2023 | $4,589 | $227,274 | $70,875 | $156,399 |
| 2022 | $4,910 | $214,060 | $53,663 | $160,397 |
| 2021 | $3,475 | $156,726 | $42,525 | $114,201 |
| 2020 | $3,675 | $162,274 | $42,525 | $119,749 |
| 2019 | $3,019 | $125,096 | $42,525 | $82,571 |
| 2018 | $3,365 | $138,736 | $42,525 | $96,211 |
| 2017 | $3,142 | $128,988 | $32,400 | $96,588 |
| 2016 | $3,128 | $112,069 | $32,400 | $79,669 |
| 2015 | $2,274 | $95,000 | $32,400 | $62,600 |
| 2013 | -- | $87,974 | $32,400 | $55,574 |
Source: Public Records
Map
Nearby Homes
- 125 W 5th St
- 201 N 3rd St
- 102 Clearman St
- 420 Woodlawn St
- 503 N 2nd St
- 4 Finley Cir
- 418 S 2nd St
- 2 Finley Cir
- 438 South St
- 220 Brook Cir
- 7257 Christina Ct
- 7272 Christina Ct
- 209 Mourning Dove Ln
- 101 N 7th St
- 107 N 7th St
- 124 Fm 2450
- TBD Hopkins Rd
- 2751 Mitchell Rd
- 3425 Eloise Ln
- 0 Farm To Market Road 1173
- 525 W Lloyd St
- 511 W Lloyd St
- 524 W Lake St
- 522 W Lake St
- 527 W Lloyd St
- 526 Lakeside Pkwy
- 510 W Lloyd St
- 514 W Lloyd St
- 128 W 5th St
- 201 N 4th St
- 504 W Lloyd St
- 529 W Lloyd St
- 126 W 5th St
- 126 W 5th St
- 126 1/2 W 5th St
- 502 W Lloyd St
- 417 Valley View Ln
- 517 W Lake St
- 419 Valley View Ln
- 413 Valley View Ln
Your Personal Tour Guide
Ask me questions while you tour the home.