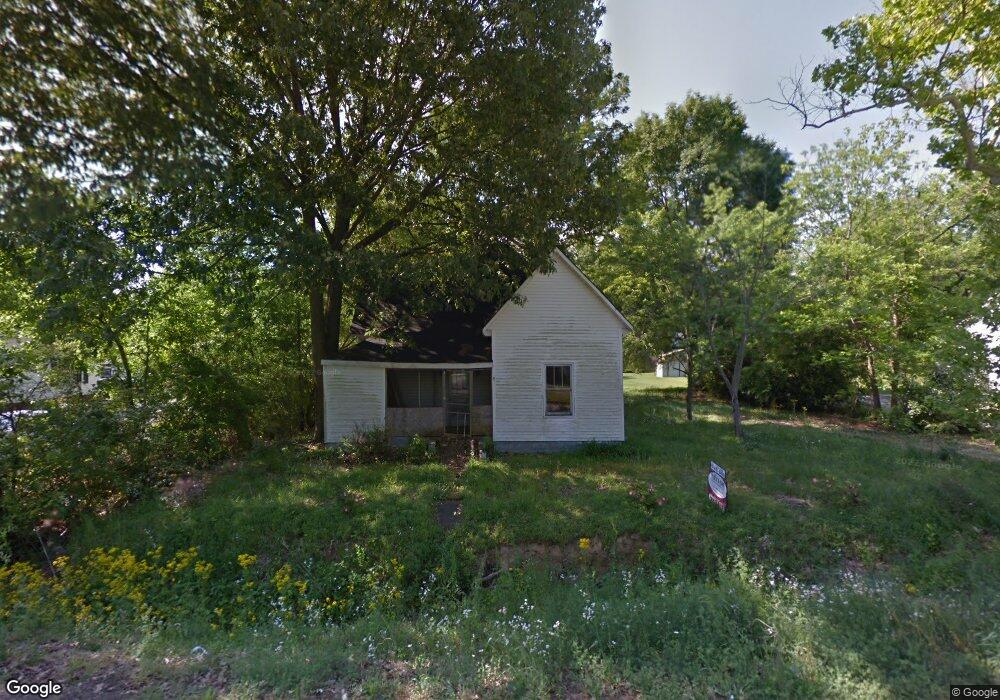
521 W Main St Rutherford, TN 38369
Estimated Value: $39,000 - $149,000
Studio
1
Bath
1,112
Sq Ft
$85/Sq Ft
Est. Value
About This Home
This home is located at 521 W Main St, Rutherford, TN 38369 and is currently estimated at $94,000, approximately $84 per square foot. 521 W Main St is a home located in Gibson County with nearby schools including Rutherford Elementary School and Gibson County High School.
Ownership History
Date
Name
Owned For
Owner Type
Purchase Details
Closed on
Oct 30, 2014
Sold by
Landaire Inc
Bought by
Durall Lucas
Current Estimated Value
Purchase Details
Closed on
Apr 8, 2014
Sold by
City Of Rutherford
Bought by
Grant David
Purchase Details
Closed on
Aug 9, 2010
Sold by
Gant Daniel A
Bought by
Walker Robert T
Purchase Details
Closed on
Dec 21, 2009
Sold by
Henderson William Byron
Bought by
Gant Daniel A
Purchase Details
Closed on
Jun 19, 1999
Sold by
Greer Rebecca
Bought by
Henderson William B
Home Financials for this Owner
Home Financials are based on the most recent Mortgage that was taken out on this home.
Original Mortgage
$8,193
Interest Rate
7.13%
Purchase Details
Closed on
Jun 11, 1991
Bought by
Greer Rebecca
Purchase Details
Closed on
Dec 9, 1948
Bought by
Swink Ralph and Swink Louise
Purchase Details
Closed on
Jan 3, 1900
Purchase Details
Closed on
Jan 2, 1900
Create a Home Valuation Report for This Property
The Home Valuation Report is an in-depth analysis detailing your home's value as well as a comparison with similar homes in the area
Purchase History
| Date | Buyer | Sale Price | Title Company |
|---|---|---|---|
| Durall Lucas | $1,000 | -- | |
| Grant David | $300 | -- | |
| Walker Robert T | $10,000 | -- | |
| Gant Daniel A | $5,540 | -- | |
| Henderson William B | $12,000 | -- | |
| Greer Rebecca | -- | -- | |
| Swink Ralph | -- | -- | |
| -- | -- | -- | |
| -- | -- | -- |
Source: Public Records
Mortgage History
| Date | Status | Borrower | Loan Amount |
|---|---|---|---|
| Previous Owner | Not Available | $8,193 |
Source: Public Records
Tax History
| Year | Tax Paid | Tax Assessment Tax Assessment Total Assessment is a certain percentage of the fair market value that is determined by local assessors to be the total taxable value of land and additions on the property. | Land | Improvement |
|---|---|---|---|---|
| 2025 | $87 | $2,250 | $2,250 | $0 |
| 2024 | $78 | $2,250 | $2,250 | $0 |
| 2023 | $54 | $1,725 | $1,725 | $0 |
| 2022 | $65 | $2,150 | $1,725 | $425 |
| 2021 | $83 | $2,725 | $1,725 | $1,000 |
| 2020 | $136 | $2,725 | $1,725 | $1,000 |
| 2019 | $132 | $2,725 | $1,725 | $1,000 |
| 2018 | $135 | $2,700 | $1,725 | $975 |
| 2017 | $279 | $2,700 | $1,725 | $975 |
| 2016 | $285 | $5,775 | $1,725 | $4,050 |
| 2015 | $253 | $5,775 | $1,725 | $4,050 |
| 2014 | $319 | $7,275 | $1,725 | $5,550 |
Source: Public Records
Map
Nearby Homes
- 531 W Knox St
- 511 W Knox St
- 516 W Knox St
- 511 Mcknight St
- 321 W Main St
- 113 N West St
- 201 Cross St
- 130 Callis Dr
- 105 S Trenton St
- 112 Fox St
- 107 Hopper St
- 228 SE Front St
- 201 E Main St
- 944 Mcknight St
- 0 Rutherford-Kenton & Hwy 45 Bypass W Unit 2601305
- 0 Rutherford-Kenton Rd & Hwy 45 Bypass W Unit RRA46254
- 23 Gravettes Crossing Rd W
- 205 Division St
- 115 High St
- 403 E College St
Your Personal Tour Guide
Ask me questions while you tour the home.