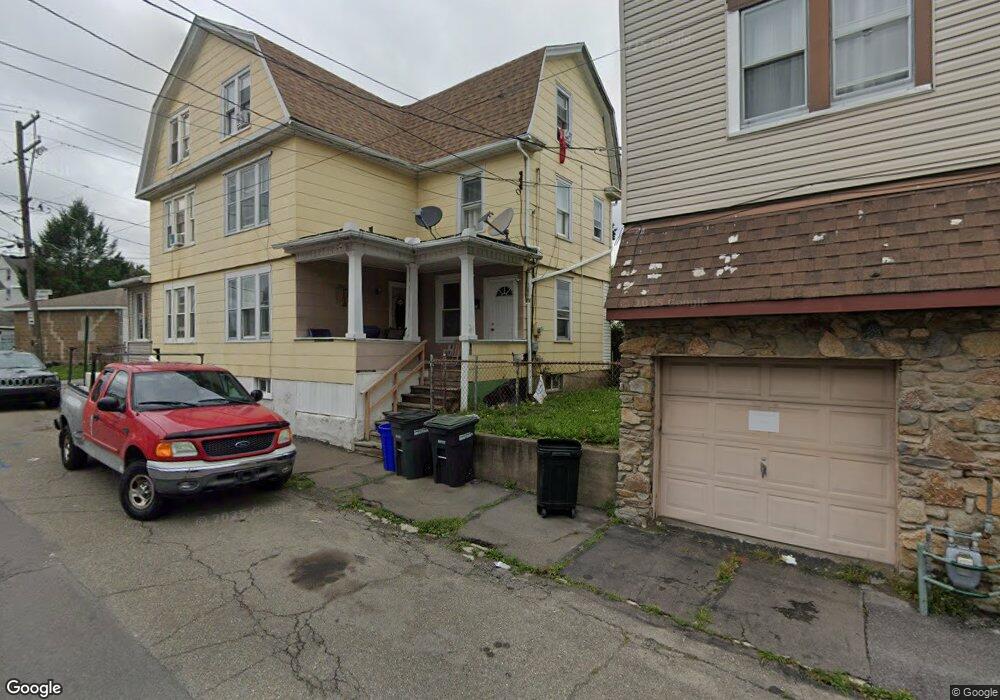
521 W Maple St Hazleton, PA 18201
Estimated Value: $135,643 - $173,000
Studio
--
Bath
1,752
Sq Ft
$92/Sq Ft
Est. Value
About This Home
This home is located at 521 W Maple St, Hazleton, PA 18201 and is currently estimated at $160,661, approximately $91 per square foot. 521 W Maple St is a home located in Luzerne County with nearby schools including Hazleton Area High School, Immanuel Christian School, and Holy Family Academy.
Ownership History
Date
Name
Owned For
Owner Type
Purchase Details
Closed on
Mar 16, 2016
Sold by
Stancu Jon and Stancu Draga
Bought by
Vasquez Jose
Current Estimated Value
Purchase Details
Closed on
Jul 22, 2013
Sold by
Nunez Pedro
Bought by
Vasquez Jose M
Purchase Details
Closed on
Sep 24, 2012
Sold by
Stancu Jon and Stancu Droya
Bought by
Nunez Pedro
Create a Home Valuation Report for This Property
The Home Valuation Report is an in-depth analysis detailing your home's value as well as a comparison with similar homes in the area
Home Values in the Area
Average Home Value in this Area
Purchase History
| Date | Buyer | Sale Price | Title Company |
|---|---|---|---|
| Vasquez Jose | $500 | None Available | |
| Vasquez Jose M | $32,000 | None Available | |
| Nunez Pedro | $5,000 | None Available |
Source: Public Records
Tax History
| Year | Tax Paid | Tax Assessment Tax Assessment Total Assessment is a certain percentage of the fair market value that is determined by local assessors to be the total taxable value of land and additions on the property. | Land | Improvement |
|---|---|---|---|---|
| 2026 | $1,249 | $60,800 | $17,100 | $43,700 |
| 2025 | $1,746 | $60,800 | $17,100 | $43,700 |
| 2024 | $1,636 | $60,800 | $17,100 | $43,700 |
| 2023 | $1,530 | $60,800 | $17,100 | $43,700 |
| 2022 | $1,518 | $60,800 | $17,100 | $43,700 |
| 2021 | $1,483 | $60,800 | $17,100 | $43,700 |
| 2020 | $1,325 | $60,800 | $17,100 | $43,700 |
| 2019 | $1,367 | $60,800 | $17,100 | $43,700 |
| 2018 | $1,321 | $60,800 | $17,100 | $43,700 |
| 2017 | $1,218 | $60,800 | $17,100 | $43,700 |
| 2016 | $866 | $60,800 | $17,100 | $43,700 |
| 2015 | $448 | $60,800 | $17,100 | $43,700 |
| 2014 | $448 | $60,800 | $17,100 | $43,700 |
Source: Public Records
Map
Nearby Homes
- 360 W Spruce St
- 1 W Diamond Ave
- 116 N Laurel St
- 52 N Laurel St
- 187 N Church St
- 403 W 7th St
- 127 W Diamond Ave
- 118 E Green St
- 714 Alter St
- ER.126 W Aspen St
- 101 S Wyoming St
- 14 W 4th St
- 90 N Cedar St
- Lot 46 Mountain Laurel Dr
- 14 Nicole Ln
- 60 E Jefferson Ave
- 193 S Cedar St
- 239 Lincalis St
- 218 North St
- 325 E Elm St
Your Personal Tour Guide
Ask me questions while you tour the home.