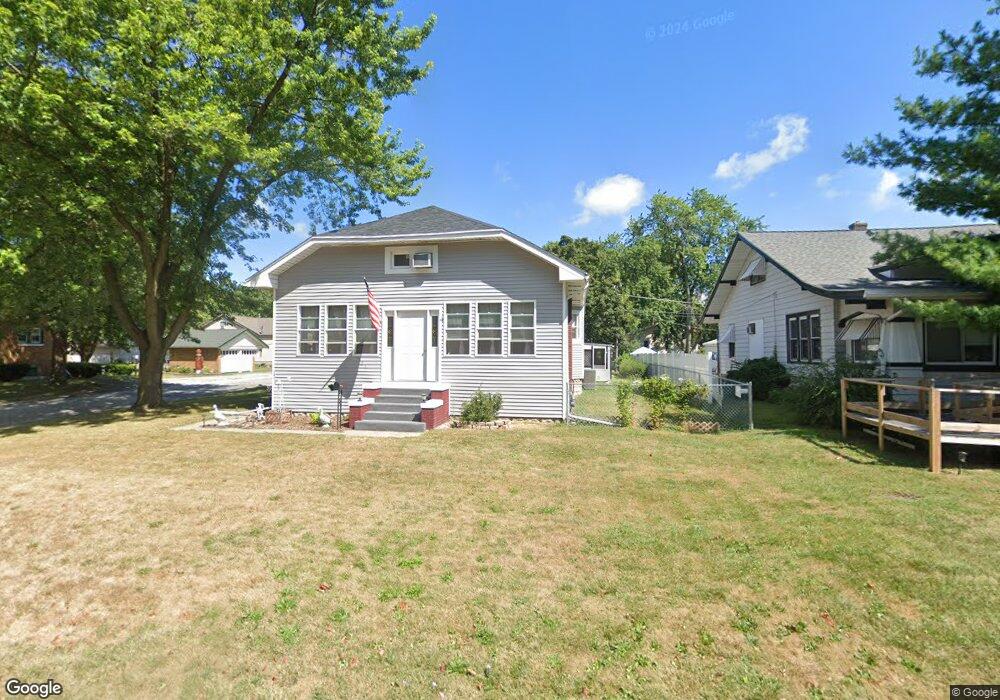
521 W Reynolds St Pontiac, IL 61764
Estimated Value: $112,780 - $148,000
3
Beds
2
Baths
1,498
Sq Ft
$88/Sq Ft
Est. Value
About This Home
This home is located at 521 W Reynolds St, Pontiac, IL 61764 and is currently estimated at $131,945, approximately $88 per square foot. 521 W Reynolds St is a home located in Livingston County with nearby schools including Central Elementary School, Lincoln Elementary School, and Washington Elementary School.
Create a Home Valuation Report for This Property
The Home Valuation Report is an in-depth analysis detailing your home's value as well as a comparison with similar homes in the area
Home Values in the Area
Average Home Value in this Area
Tax History Compared to Growth
Tax History
| Year | Tax Paid | Tax Assessment Tax Assessment Total Assessment is a certain percentage of the fair market value that is determined by local assessors to be the total taxable value of land and additions on the property. | Land | Improvement |
|---|---|---|---|---|
| 2024 | $797 | $28,489 | $3,855 | $24,634 |
| 2023 | $830 | $26,650 | $3,606 | $23,044 |
| 2022 | $867 | $24,245 | $3,606 | $20,639 |
| 2021 | $877 | $23,312 | $3,467 | $19,845 |
| 2020 | $999 | $22,611 | $3,363 | $19,248 |
| 2019 | $916 | $21,621 | $3,216 | $18,405 |
| 2018 | $1,492 | $27,171 | $3,248 | $23,923 |
| 2016 | $2,033 | $27,473 | $3,284 | $24,189 |
| 2015 | $2,054 | $27,473 | $3,284 | $24,189 |
| 2013 | $2,208 | $28,021 | $3,520 | $24,501 |
Source: Public Records
Map
Nearby Homes
- 615 W South St
- 319 W Moulton St
- 734 W Henry St
- 721 W South St
- 811 W South St
- 304 S Mill St
- 219 W Bennett St
- 409 W Water St
- 101 E Grove St
- 119 W Lowell Ave
- 2 W Edgewood Dr
- 772 S Locust St
- 110 W Olive St
- 503 W Livingston St
- 205 E Howard St
- 219 E Howard St
- 510 E Washington St
- 606 N Ladd St
- Lot 3 W Cleary St
- 105 Carol Ct Unit C-1
- 519 W Reynolds St
- 515 W Reynolds St
- 601 W Reynolds St
- 526 W South St
- 522 W South St
- 509 W Reynolds St
- 607 W Reynolds St
- 520 W South St
- 604 W South St
- 522 W Reynolds St
- 520 W Reynolds St
- 501 W Reynolds St
- 504 W South St
- 612 W South St
- 609 W Reynolds St
- 602 W Reynolds St
- 10658 E 1700 North Rd
- 10690 E 1700 North Rd
- 10690 E 1700 North Rd
- 500 W South St