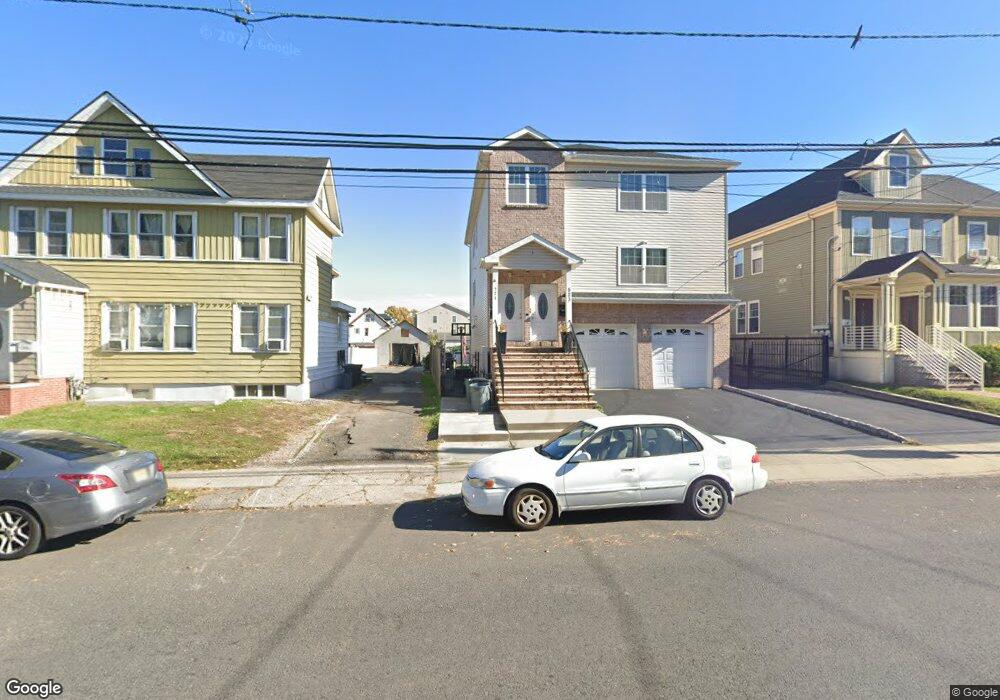
521 Walnut St Unit 3 Elizabeth, NJ 07201
Downtown Elizabeth NeighborhoodEstimated Value: $727,000 - $964,448
6
Beds
5
Baths
2,916
Sq Ft
$300/Sq Ft
Est. Value
About This Home
This home is located at 521 Walnut St Unit 3, Elizabeth, NJ 07201 and is currently estimated at $875,112, approximately $300 per square foot. 521 Walnut St Unit 3 is a home located in Union County with nearby schools including Toussaint L'ouverture-Marquis de Lafayette School No. 6 and Elizabeth High School.
Ownership History
Date
Name
Owned For
Owner Type
Purchase Details
Closed on
Feb 21, 2018
Sold by
Djk Construction Llc
Bought by
Harris Rondel E
Current Estimated Value
Home Financials for this Owner
Home Financials are based on the most recent Mortgage that was taken out on this home.
Original Mortgage
$510,581
Outstanding Balance
$435,205
Interest Rate
4.25%
Mortgage Type
FHA
Estimated Equity
$439,907
Purchase Details
Closed on
Oct 13, 2015
Sold by
B & B Investments Llc
Bought by
Djk Construction Llc
Purchase Details
Closed on
Nov 7, 2014
Sold by
B & B Investments Llc
Bought by
B & B Investments Llc
Purchase Details
Closed on
Mar 22, 2014
Sold by
Alcine Robert
Bought by
B & B Investments Llc and Extreme Investments Llc
Purchase Details
Closed on
Jun 29, 2006
Sold by
Grant John A
Bought by
Alcine Robert
Home Financials for this Owner
Home Financials are based on the most recent Mortgage that was taken out on this home.
Original Mortgage
$337,500
Interest Rate
6.7%
Create a Home Valuation Report for This Property
The Home Valuation Report is an in-depth analysis detailing your home's value as well as a comparison with similar homes in the area
Home Values in the Area
Average Home Value in this Area
Purchase History
| Date | Buyer | Sale Price | Title Company |
|---|---|---|---|
| Harris Rondel E | $520,000 | Westcor Land Title Ins Co | |
| Djk Construction Llc | $110,000 | -- | |
| B & B Investments Llc | -- | -- | |
| B & B Investments Llc | $100,000 | Ats Title Agency Inc | |
| Alcine Robert | $375,000 | -- |
Source: Public Records
Mortgage History
| Date | Status | Borrower | Loan Amount |
|---|---|---|---|
| Open | Harris Rondel E | $510,581 | |
| Previous Owner | Alcine Robert | $337,500 |
Source: Public Records
Tax History Compared to Growth
Tax History
| Year | Tax Paid | Tax Assessment Tax Assessment Total Assessment is a certain percentage of the fair market value that is determined by local assessors to be the total taxable value of land and additions on the property. | Land | Improvement |
|---|---|---|---|---|
| 2025 | $16,121 | $837,900 | $228,200 | $609,700 |
| 2024 | $17,287 | $837,900 | $228,200 | $609,700 |
| 2023 | $17,287 | $55,000 | $12,300 | $42,700 |
| 2022 | $3,761 | $12,300 | $0 | $0 |
| 2021 | $3,684 | $12,300 | $0 | $0 |
| 2020 | $2,693 | $12,300 | $0 | $0 |
| 2019 | $3,545 | $61,800 | $12,300 | $49,500 |
| 2018 | $4,082 | $14,300 | $12,300 | $2,000 |
| 2017 | $10,433 | $37,600 | $12,300 | $25,300 |
| 2016 | $10,434 | $37,600 | $12,300 | $25,300 |
| 2015 | $9,813 | $37,600 | $12,300 | $25,300 |
| 2014 | -- | $37,600 | $12,300 | $25,300 |
Source: Public Records
Map
Nearby Homes
- 532 Walnut St
- 478 Walnut St
- 474 Walnut St Unit 6
- 464-466 Walnut St
- 539 Jefferson Ave
- 568 Pennsylvania Ave
- 576 Walnut St
- 566 Pennsylvania Ave Unit E1&2
- 514 Madison Ave
- 504 Madison Ave
- 600 Pennsylvania Ave Unit 602
- 410 Jefferson Ave
- 580 Monroe Ave
- 632 Monroe Ave
- 1117 Chestnut St
- 1071 Bond St
- 570 Jackson Ave
- 1063 Bond St
- 134-138 Parker Rd
- 136 Parker Rd
- 521-523 Walnut St Unit 2
- 521-523 Walnut St
- 517-519 Walnut St
- 517 Walnut St Unit second
- 517 Walnut St Unit 519
- 517 Walnut St
- 525 Walnut St Unit 527
- 527 Walnut St
- 515 Walnut St Unit 1
- 515 Walnut St Unit 2
- 529 Walnut St Unit 531
- 513 Walnut St
- 533 Walnut St
- 528-530 Jefferson Ave
- 535 Walnut St
- 520 Walnut St Unit 522
- 522 Walnut St Unit 524
- 528 Jefferson Ave Unit 530
- 1159 Mary St Unit 1161
- 541 Walnut St Unit B1m